Archaeologists were early adopters of unmanned aerial vehicle (UAV) systems, extending a long tradition of low-altitude aerial photography for site documentation and landscape survey (Verhoeven Reference Verhoeven2009, Reference Verhoeven2011). UAV use in archaeology has accelerated recently, given the affordability of “out-of-the-box” quadrotor-UAV platforms and the reduced cost of photogrammetric software for processing drone-produced imagery (Gutiérrez and Searcy Reference Gutiérrez and Searcy2016). While quadrotor UAVs may represent more technical firepower than strictly necessary for microscale documentation (i.e., excavation units or individual features), recent reviews concur that they are not efficient enough platforms for the macroscale (i.e., broad exploratory landscape survey and aerial reconnaissance) (Campana Reference Campana2017: 289; Colomina and Molina Reference Colomina and Molina2014). These low-cost and easy-to-use platforms therefore seem best suited for covering the mesoscale, including the level of entire sites and their catchment areas (Campana Reference Campana2017: 279; Hill and Rowan Reference Hill and Rowan2017). Furthermore, quadrotor UAV systems represent a feasible entry-level option for archaeological projects with limited budgets or nonspecialist personnel who are interested in producing technical quality aerial photographs and digital elevation models to answer research questions rather than for illustration alone (Lang et al. Reference Lang, Behrens, Schmidt, Svoboda, Schmidt, Campana, Scopigno, Carpentiero and Cirillo2016; Parcero-Oubiña et al. Reference Parcero-Oubiña, Manana-Borrazas, Guimil-Farina, Fabrega-Alvarez, Pino and Borie2016).
This article outlines the primary phases of research using a quadrotor UAV to address mesoscale research problems. In our own experience, we found a gap in the UAV literature between technical/operational manuals and the interpretation(s) of post-processed imagery (but see Barnes and Volkmann Reference Barnes and Volkmann2015). Our aim in this paper is to partially fill this gap, emphasizing the needs of projects based in remote locales with limited internet access. Our target audience is nonspecialist or novice UAV operators who may find themselves, as we did, with an out-of-the-box drone and software package, a particular set of research aims to tackle in difficult and remote field conditions, and with little guidance on how to practically link these within the scope of a field project. We therefore focus on planning, implementing, and troubleshooting mesoscale UAV survey and the processing of imagery for orthophoto and topographic map production.
RESEARCH CONTEXT AND BACKGROUND TO UAV SURVEY
Our research is centered in a remote area of central Eurasia, in an alluvial fan with a dense archaeological landscape comprising more than 5,000 years of occupation. Since the 1990s, large-scale, collaborative international survey projects have been integrating newly collected data with that of earlier Russian and Soviet archaeology in this region (e.g., Gubaev et al. Reference Gubaev, Koshelenko and Tosi1998; Salvatori et al. Reference Salvatori, Tosi and Cerasseti2008). A long-term goal of our research project is to comprehensively map the mesoscale landscape related to a single, long-lived urban site, a research task that has never been undertaken in this region. Such a map would provide data about the spatial configuration of urban centers and their outlying settlements, the availability and potential use of water and other natural resources in a given territory, and in conjunction with chronological data from the larger project, help us to understand diachronic changes in the socio-natural landscape (see Cerasetti et al. Reference Cerasetti, Codini, Rouse, Lamberg-Karlovsky, Genito and Cerasetti2014).
The datasets available from previous research lack the coverage and detail necessary to interpret a population center within its socio-natural landscape. Satellite imagery (ASTER, Landsat, Ikonos, Spot, Soyuz) and aerial photography (CORONA, Soviet-era reconnaissance) are available for parts of the alluvial fan, but none of these offer the combination of ground resolution (<2 m) and geographical coverage necessary to achieve our goals: 1) detailed, landscape-oriented archaeological mapping of sites and surface materials; and 2) recognizing smaller watercourses of the ancient hydrological system. Purchase of more detailed imagery of the research area was not within the project budget, and regulatory restrictions meant chartering low-altitude aerial reconnaissance was also not an option. Given these conditions and our project's objective to understand the socio-natural environment of our research site, we determined an entry-level quadrotor UAV system was the most feasible option for mapping entire sites and their environs with high resolution and spatial fidelity at the mesoscale—in this case, between 1 and 5 km2 (Molloy Reference Molloy and Molloy2016; see also Gutiérrez et al. Reference Gutiérrez, Erny, Friedman, Godsey and Gradoz2016; Mesas-Carrascosa et al. Reference Mesas-Carrascosa, García, de Larriva and García-Ferrer2016).
Numerous publications discuss specific segments of the UAV-photogrammetry workflow; for example, flight planning and on-site execution (e.g., Field et al. Reference Field, Waite and Wandsnider2017; Hamilton and Stephenson Reference Hamilton and Stephenson2016; Nex and Remondino Reference Nex and Remondino2014) and the accuracy of the models derived from photogrammetric analysis (e.g., Baliño Reference Baliño2016; Dubbini et al. Reference Dubbini, Curzio and Campedelli2016; Harwin and Lucieer Reference Harwin and Lucieer2012; Lo Brutto et al. Reference Lo Brutto, Garrafa and Meli2014; Martínez-del-Pozo et al. Reference Martínez-del-Pozo, Cerrillo-Cuenca and Salas-Tovar2013; Mesas-Carrascosa et al. Reference Mesas-Carrascosa, García, de Larriva and García-Ferrer2016; Nocerino et al. Reference Nocerino, Menna, Remondino and Saleri2013; Ortiz et al. Reference Ortiz, Gil, Martinez, Rego and Meijide2013). While we appreciate these contributions for the precision, detail, and depth they offer to UAV research, as newcomers to drone-based archaeological survey, we were discouraged by the scarcer availability of publications that pragmatically discuss both field protocols and post-processing workflows to produce the two main outputs of UAV-based survey; namely, (1) digital models of topographic surfaces or monuments, and (2) orthophoto mosaics of excavations and landscapes (but see Chiabrando et al. Reference Chiabrando, Nex, Piatti and Rinaudo2011; Fernández-Hernandez et al. Reference Fernández-Hernandez, González-Aguilera, Rodríguez-Gonzálvez and Mancera-Taboada2015; Turner et al. Reference Turner, Lucieer and Watson2012; Wernke et al. Reference Wernke, Adams and Hooten2014).
What follows is a beginner's guide for planning and executing a drone-based, mesoscale archaeological survey aimed at deriving these two outputs. We base our recommendations on our own experiences as we progressed through the stages of archaeological fieldwork but suggest they are relevant for a range of archaeological projects. The following discussion should be useful for survey-oriented projects of medium scale, undertaken by archaeologists new to UAV systems, in remote field locations where the internet may not be available to answer questions as they arise. We offer advice for choosing equipment and software and tips for planning, executing, and troubleshooting UAV survey and the initial in-field processing of resulting imagery for archaeological investigations of mesoscale landscapes.
FUNDAMENTALS IN THE USE OF QUADROTOR UAVs FOR MESOSCALE AERIAL SURVEY
Rather than present a step-by-step protocol for conducting UAV survey, which would differ for projects with diverse settings and objectives, we discuss the rudiments of the overall method. A UAV-photogrammetry survey involves several phases, from the selection of equipment, to mission planning, pre- and in-field preparation, image capture, and post-processing. We do not advocate for any specific software or hardware packages, but rather make recommendations regarding desirable affordances found in a variety of devices and applications. Throughout this article, we strive to balance the presentation of examples based on the specific platforms we tested with a more generalized discussion relevant to other hardware and software that researchers may choose to use. Importantly, the selection of equipment and fieldwork plan must adhere to legal, ethical, and safety guidelines governing the flight of UAVs in the jurisdiction of the planned fieldwork (Hill Reference Hill2013; Limp and Williamson Reference Limp and Williamson2017; Searcy Reference Searcy2016).
Equipment and Components
Different hardware and software may be integrated into research in diverse field settings, but for mesoscale landscape survey, we recommend certain classes of equipment for reasons explained below (Table 1). In terms of hardware, entry-level users may prefer copter-style UAVs over fixed-wing options (see Barnes and Volkmann Reference Barnes and Volkmann2015:6) due to their compact size (for transportation to the field), their greater maneuverability during flight (taking off and landing vertically, hovering), and their traditionally lower cost (though costs for fixed-wing drones have decreased in recent years). A range of quadrotor and multirotor platforms are widely available (Washington University Libraries 2017) to suit the anticipated needs of the project and the flight regulations of the fieldwork location (import/export and customs restrictions will be an important consideration for non-U.S.-based fieldwork). In terms of the flight software available, a cottage industry of mobile applications has emerged for both iOS and Android devices (Table 2). Likewise, desktop and web-based photogrammetric processing is supported by an increasing variety of software packages (Table 3).
TABLE 1. Hardware Used during the 2017 PAM Pilot Study.
TABLE 2. Selection of Current Drone Piloting Applications on the Market.
Note: These applications afford polygon-based flight-planning and control over flight parameters such as elevation, forward- and side-overlap percentages, flight speed, and camera angle.
TABLE 3. UAV-Ready Photogrammetry Software Packages and Web Applications.

The basic kit includes the UAV, its remote controller (RC), a mobile device (smartphone or tablet) on which to run the piloting application, batteries, SD cards, and a photogrammetric software package. We used a DJI Mavic Pro quadcopter with an iPhone 6 connected to the remote controller. On the iPhone 6, we utilized both the manufacturer-provided flight application, DJI Go 4, and MapPilot from DronesMadeEasy for mission planning. The photogrammetry software used was Agisoft PhotoScan Professional Edition (Table 1). While we list specific proprietary hardware and software here for transparency, we stress that each component in this kit has numerous viable alternatives (Tables 2 and 3). Still, certain components of this equipment list are crucial to successful field implementation at the mesoscale; for example, battery reserves for the UAV, the RC, and the mobile device, as well as multiple SD cards. Regardless of the drone selected, it should have an onboard GPS system such that autonomous flight paths can be planned.
Field Preparations
Prior to fieldwork, the UAV pilot(s) should familiarize themselves with the equipment through test flights, preferably conducting mock surveys for evaluating the reliability and potential quirks of their UAV system (Barnes and Volkmann Reference Barnes and Volkmann2015). Test flights will also help to determine reasonable expectations for flight time (helpful for knowing how many spare batteries will be needed), SD card memory capacity, and the types of backup equipment or software to have. The pilot(s) should also investigate the potential weather conditions of their fieldwork location, as well as the likelihood of encountering obstacles such as power lines, cell-phone towers, and trees, in order to evaluate options for takeoff, flight paths, and landing. The researchers must review the safety regulations governing UAV operation of the jurisdiction in which the survey is to be carried out (Searcy Reference Searcy2016); this may require, as in the United States, various forms of official certification and licensing (FAA 2015). The specifics of these regulations can differ considerably between countries and regions, but best practices stipulate that pilots should 1) maintain line-of-sight with the drone; 2) avoid flying over groups of people; 3) steer clear of airfields, airports, power lines, cell-phone towers, trees, and other obstacles; and 4) refrain from flying over terrain where the GPS signal is weak.
Additionally, for researchers working in remote areas and where the internet is unavailable, it is essential to ensure the drone is fully functional and that the firmware of all components is up-to-date prior to fieldwork. Before departure, the researcher(s) should check for and conduct any necessary repairs or maintenance, and spare parts should be purchased and cataloged. The flight- and mission-planning applications should be installed, updated, and tested; it is also necessary to pre-cache satellite imagery of the survey tracts on the mobile device that will connect to the remote controller and provide the visual interface for flying.Footnote 1 Lastly, the photogrammetry and any additional computer software should be installed and configured.
Before conducting any flights in the field, two essential tasks at the base camp are 1) preparing all equipment and charging batteries, and 2) flight planning. For charging drone batteries, options will vary according to the particular UAV platform's specifications, each of which differs in length of charging time and the number of batteries that can be simultaneously charged. If available, we recommend the use of an array of multi-battery docks to cut down on charging time; if not, the project should purchase as many chargers as are feasible to carry to the field within budgetary constraints. Simultaneously with drone battery charging, the RC and mobile device should also be charged. In our experience, the RC and mobile device batteries were unable to provide power for an entire day of flying. Thus, if planning for a full day of flights with no midday access to an electricity source, we recommend charging two portable power banks, or for the more technologically savvy and where appropriate, a portable solar array for recharging the RC and mobile device during a midday break. In addition to charging all batteries at the base camp, the team should identify which and how many flights will be flown during the next workday. Finally, the pilot(s) should ensure sufficient space on the SD cards to accommodate the planned flight missions.
Flight Planning
After conducting field tests of DJI Go's “Waypoints” feature and flying the UAV manually, we determined that efficient mesoscale survey requires the use of a flight-planning application on the mobile device. In some cases, the manufacturer-supplied application will feature autonomous flight capabilities, but in the case that it does not (as with the DJI proprietary software available in spring 2017), the use of an additional application for flight planning is critical (Figure 1; Table 2). These flight-planning applications allow users to specify autonomous missions by plotting survey polygons and selecting flight parameters such as speed, altitude, and forward- and side-overlap percentages, among others. In theory, the survey polygon could be as large as the entire study area to be covered because many mission planning applications automatically calculate and report how many batteries would be required to successfully complete the mission. In practice, we found the in-field transition between individual flights making up one large mission to be error prone, particularly with regard to both the drone and the piloting application storing and recalling where the previous flight had ended and being able to resume from there with a new battery. We therefore recommend planning for each mission to be conducted within the range covered by one drone battery.
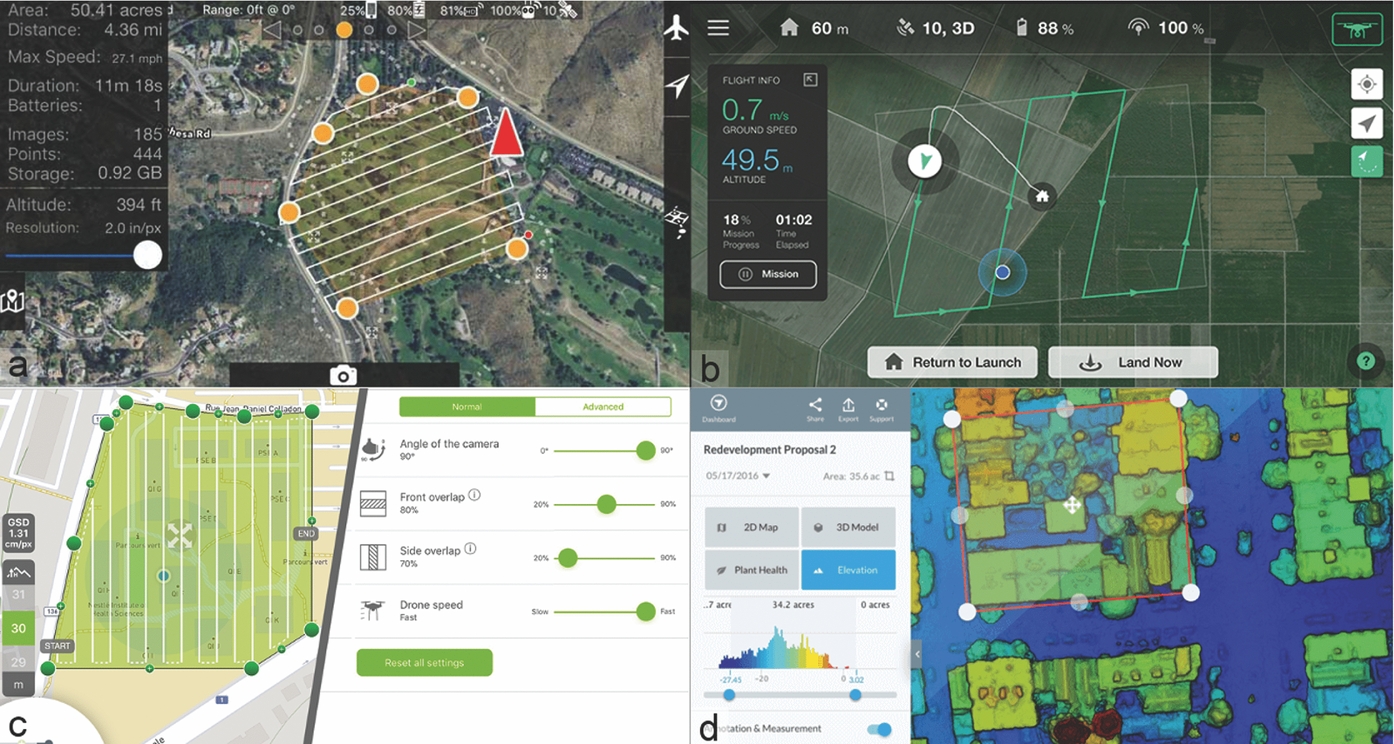
FIGURE 1. Screenshots of a selection of autonomous flight-planning applications: (a) MapPilot, (b) Precision Flight, (c) DroneDeploy, and (d) Pix4D.
The areal coverage of a single flight will vary depending on the specific UAV model, flight parameters, and weather conditions; high winds and extreme temperatures, for example, can greatly reduce battery life and thereby shorten flight times. In Table 4 we present a matrix of flight parameters and outcomes specific to our particular equipment configuration under ideal weather conditions, which may serve as a general reference. Of course, any project's particular objectives and equipment will be unique, but for mesoscale archaeological surveys aiming for full landscape coverage of several square kilometers, including identification of smaller surface features such as potsherd scatters, with detailed topographic potential (sub-5 cm), we recommend flying at an altitude between 30 m and 60 m, with a 65% forward-overlap and 60% side-overlap (compare with Barnes and Volkmann Reference Barnes and Volkmann2015; Mesas-Carrascosa et al. Reference Mesas-Carrascosa, García, de Larriva and García-Ferrer2016; Mouget and Lucet Reference Mouget and Lucet2014). These parameters provide an adequate baseline for survey (see below for a discussion of its efficacy in our study), though researchers may wish to rebalance these parameters differently according to specific project priorities regarding areal coverage and/or resolution.
TABLE 4. Estimated Flight Parameters Using Our Equipment Setup.
Note: These figures were calculated using MapPilot by drawing the largest possible polygon that could be flown on a single battery using combinations of forward- and side-overlap percentages recommended in the literature (i.e., 80%/50% from Mesas-Carrascosa et al. Reference Mesas-Carrascosa, García, de Larriva and García-Ferrer2016 and 65%/60% from Mouget and Lucet Reference Mouget and Lucet2014) with four elevation intervals.
Ground Control Points
At the mesoscale, ground control points (GCPs) are necessary to ensure the spatial accuracy and fidelity of both digital terrain models and orthophoto mosaics (Mesas-Carrascosa et al. Reference Mesas-Carrascosa, García, de Larriva and García-Ferrer2016). These properties are crucial if the objective of a project is to derive measurements from the output models and to integrate them with other forms of geospatial information (Eisenbeiß and Sauerbier Reference Eisenbeiß and Sauerbier2011; Verhoeven et al. Reference Verhoeven, Wieser, Briese and Doneus2013). However, not all field projects require this, especially rescue/rapid-response and pilot surveys and those where the output models will not serve as the basis for measurements (Karel et al. Reference Karel, Doneus, Briese, Verhoeven and Pfeifer2014; Neitzel and Klonowski Reference Neitzel and Klonowski2011:5; Nex and Remondino Reference Nex and Remondino2014:6). Therefore, there are two approaches to georeferencing and the use of GCPs.
The first strategy, direct georeferencing, anchors photogrammetric models in a coordinate system using only the spatial metadata attached to the photographs from the UAV's navigation system. Output models using this method will therefore only be as accurate as the drone's onboard GPS, which is not necessarily consistent across flights, because of the constantly changing number and signal quality of GPS satellites being utilized (Neitzel and Klonowski Reference Neitzel and Klonowski2011). Still, this level of accuracy may be sufficient for the goals of some projects, especially if initial UAV exploration of an undocumented or threatened landscape will be followed up with targeted pedestrian or more accurate types of aerial survey. The second strategy for georeferencing UAV imagery, indirect georeferencing, uses GCPs to anchor the photogrammetric model in a specific coordinate system. This approach ensures easier and more consistent georeferencing across multiple flights (Mesas-Carrascosa et al. Reference Mesas-Carrascosa, García, de Larriva and García-Ferrer2016).
In the indirect georeferencing approach, secure targets are placed on the ground in the survey zone and their coordinates recorded in the field prior to flights. In relatively homogenous and/or flat terrain, such as our survey area, it may be possible to lay out GCPs at regular intervals or on a grid (Figure 2). In field settings with more diverse landscapes, GCPs should be placed to sufficiently cover the entire survey area and to be distributed evenly across different types of terrain and elevations (Mesas-Carrascosa et al. Reference Mesas-Carrascosa, García, de Larriva and García-Ferrer2016:4; Turner et al. Reference Turner, Lucieer and Watson2012:1405–1407). Furthermore, care should be taken that GCPs will not end up in the shade as the sun moves during the day, and if the GCPs will serve for multiple days of flights (such as for a large survey tract), they must be securable and placed where they will not be disturbed or destroyed. Under these conditions, it is also critical to keep track of which GCPs a given flight covers in the field.
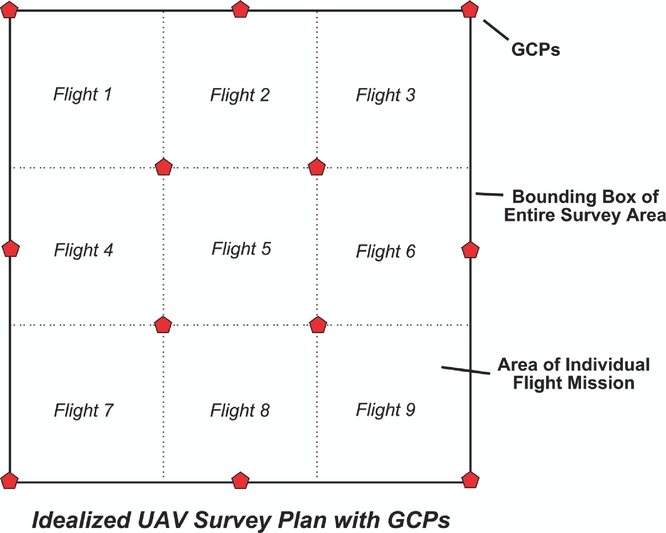
FIGURE 2. Ideal placement of ground control points over a survey tract with relatively homogenous terrain and elevation distribution. Projects operating under different conditions will need to adjust accordingly.
In principle, the targets themselves may be any kind of static object; in practice, however, it is best to use a standardized set of physical markers placed by the research team. These can be purchased or homemade (usually for very low cost). For accuracy and accountability, best practice is to use printed coded targets for GCPs. Coded targets vary in format according to the photogrammetric software used, but all function similarly, allowing the software to automatically detect the location of the targets during post-processing, akin to a QR code (e.g., Agisoft 2017a). For flights at low altitudes (e.g., 30 m), the GCP targets should be minimally 30 cm in diameter and should increase in size in proportion with increased altitude and the camera's resolution, otherwise they may not be detectable in the imagery. In all cases, the color of the targets should contrast strongly with the surrounding environment.
Once fixed in place, the location of the GCP targets should be recorded. It should be noted that a handheld GPS “wayfinder” will not give sufficiently accurate or consistent readings for locating the GCPs in real space (this presents a similar problem to utilizing only the UAV's onboard GPS for georeferencing). The use of a Global Navigation Satellite System (e.g., Differential GPS or Real-Time Kinematic) is therefore highly recommended, though the use of a Total Station or Transit working from an accurate datum will also suffice over short-to-medium distances. The latter approach may in fact be more amenable to projects working from an already established arbitrary grid, which would afford direct alignment with site-specific grids derived from previous mapping campaigns. In any case, the GCP coordinate locations should be logged both on paper and in the positional recording device, taking care that the GCPs are individually identified through a systematic naming convention, and these data stored until they are ready to be used in the photogrammetric processing.
Conducting the Survey Flights
Once the GCPs have been fixed, flights can be conducted. On site, the flight team should position themselves near the first flight zone for the day and complete a preflight checklist similar to the one below:
• Set up a landing pad to ensure that soil does not get kicked up into the drone's rotor assembly during takeoff and landing
• Ensure that the rotary propellers are mounted correctly and firmly, with no damage such as nicks or cracks
• Check that the remote control, drone battery, and mobile device have sufficient charge to complete the flight
• Ensure that the SD card is inserted in the drone and has enough memory for the flight
• Remove the gimbal visor and clamp, then check for proper gimbal functioning
• Check to make sure that forward and downward sensors are clean and free of debris
• Connect the mobile device to the remote controller and boot up the manufacturer-provided piloting application; wait for all automatic routines to complete, and ensure that drone has been detected by application
• Configure desired camera settings, making sure that the camera is angled straight down and that the focus is locked and set to infinityFootnote 2
• Set image capture format (.RAW or .JPG, depending on project objectives and SD card capacity) and frame size (largest possible recommended)
• If using a piloting application other than the one provided by the drone manufacturer, switch to the alternative application after camera settings are configured in the manufacturer's application
• Wait for piloting application to recognize the drone
• Double-check the flight parameters (e.g., altitude, overlap percentages, etc.)
• Take a screenshot of the piloting application interface on the mobile device, showing the flight plan and location of landing pad, and record the file name of the screenshot in the field notebook
Once the preflight checklist has been completed, the flight routine can be initiated. This will take a different form in the different applications, but typically the sequence will involve uploading the flight plan to the UAV before the flight will begin. Once the drone is in the air, the pilot must maintain line of sight, as well as periodically check the remote controller and mobile application to monitor the drone's progress and respond to in-flight errors that may arise (Table 5).
TABLE 5. In-Flight Problems and Solutions for Piloting Quadrotor UAV in the Field.
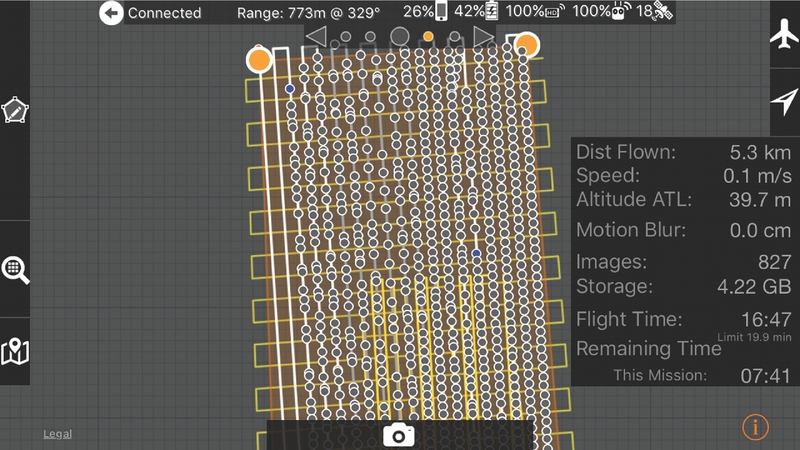
At the end of every flight, a final screenshot should be taken of the interface of the flight-planning application to record the flight path and the image details that are reported on-screen (Figure 3). The flight team should also separately record the flight's parameters, especially altitude, camera angle, and forward- and side-overlap percentages, as well as time of takeoff and landing (for example, in a field notebook or on a recording sheet similar to that in Figure 4). Although some of this information is redundant with the UAV's own metadata records, having a hard-copy backup of this data in case of loss or error falls in line with best archaeological practices in other realms of recording. Moreover, we found that having a record of the correspondence between flights and GCPs/screenshots was indispensable to reconstructing our activities for the data dump at the end of each field day, the end-of-season field report, and in further image post-processing once home from the field.

FIGURE 3. Screenshot of flight application interface (in this case, MapPilot) showing postflight record and parameters. Orange dots indicate the corners of the multi-flight mission polygon. Grey dots indicate a successful photo capture and blue dots indicate the “resume-point” from the end of a single-battery flight. The yellow lines show the flight path.

FIGURE 4. Sample field recording sheet. Paper backups to the digital record are indispensable during post-processing and laboratory analysis.
Post-Processing
At the end of each field day, the first task of the flight team is to download all the images captured during the workday to the processing computer. An ideal file-tree structure would be organized by date, location, and flight ID code, such that the images from each flight are stored separately from one another and easily connected to the field notebook. This is critical because a single flight can produce hundreds, if not thousands of photographs; coherence and consistency in file structuring and naming schema are key to both responsible data management and robust analysis (Wechsler et al. Reference Wechsler, Lipo, Lee and Hunt2016). Furthermore, researchers should daily conduct preliminary post-processing in the field on the lowest settings as a check on whether the flights accomplished adequate coverage, in addition to pruning blurry images and those photographs taken during takeoff/landing. The highest quality models can then be processed in the laboratory after returning from the field, where time and computing restraints are fewer. There are several good PhotoScan-specific tutorials on post-processing (Agisoft 2017b; Dietrich Reference Dietrich2015; Shervais and Dietrich Reference Shervais and Dietrich2016), which we tested in the field and have adapted here for archaeological research. Our comments here are based on our experience with this specific software, and some of the particular steps (or their names) of the workflow will differ in other software packages. In general, however, photogrammetry follows a similar procedure regardless of which software is used. This procedure comprises three stages: importing data, alignment and processing, and exporting models.
• The first stage is to import the images into the software workspace; if using direct georeferencing, alignment and processing can begin immediately. If pursuing an indirect georeferencing strategy, the GCP coordinate data must also be imported and individual GCPs should be located in the imagery and assigned their correct coordinates.
• The second stage is to align the images and begin processing models (where a “model” might refer to an orthophoto mosaic stitched together through many individual overhead photographs taken by the drone, or to a digital surface model [DSM] that interprets small topographic changes through algorithmic comparison of overlapping drone images). In each software package, there are many settings to choose from to begin processing imagery, but for the purpose of in-the-field processing, we found it best to select settings that prioritized speed so as to have a check on whether the imagery fully covered the intended target and was of the correct resolution to ultimately produce the level of detail we wanted in the orthophoto mosaic and DSMs (these detailed models would be created after returning from the field, when we were able to use processing settings that prioritized resolution above time constraints). In general, we recommend taking advantage of any options that are available to conduct batch or parallel processing of groups of images related to individual flights, as it is less computationally intensive to process smaller groups of images together, and it also frees researchers up for other activities as the software runs through the sequence of aligning images and building models (which can often take many hours). Subsequently, the individual flight models can then be merged together to create composite models of larger territorial units, as required by the research agenda.
• The third stage is to build and export the digital elevation model (DEM) and orthophoto outputs from the model processing, both of which will take the form of geoTIFFs. During this stage, it is important to specify the coordinate system, whether projected or geographic, that was used to georeference the model and to specify a No-Data value (such as zero or NULL) so that the edges of the model can be more easily masked when exported to a GIS. Depending on the overall ground surface coverage and the resolution of the models, it may be necessary to export the models as pieces or tiles to keep the file sizes from ballooning to unwieldy ranges (at high resolution, a model covering 50 ha can easily exceed 10 GB).
RESULTS AND DISCUSSION
Our field research forms part of a larger archaeological investigation aimed at understanding long-term fluctuations in the socio-natural landscape of a large alluvial fan, which sits in an arid zone of southern central Eurasia. As noted above, the geospatial data that would otherwise form the backdrop for this study is patchy and of inconsistent quality. Additionally, the size of the area under investigation, in combination with short field seasons and the density of known material, made extensive pedestrian survey unfeasible. Our research team therefore needed a method for mapping the spread of archaeological sites and material and the extent of ancient watercourses that would be cost effective, easy to implement, and updatable over the course of several years of research. UAV survey seemed to meet all our needs, and we carried out a feasibility pilot study focused around a known but poorly documented site. This site consists of a 4 m high occupation mound covering 10 ha, largely unexcavated save for three limited test trenches opened over the last 40 years. Surrounding the site, previous work by our research team had identified scatters of archaeological material and disconnected lengths of ancient watercourses, but these features represented only windows into the ancient landscape, and their overall spatial connection to one another and the occupation mound was poorly understood. Our pilot study therefore aimed to gauge the reliability and accuracy of UAV imagery for mapping archaeological and hydrological features in this landscape, and to assess the ease of use of this technology in the field by nonspecialists, which would prove critical for future fieldwork planning.
The research area in question in many ways offered a best-case scenario for testing the feasibility of a UAV system to the study of the mesoscale landscape. The ground cover is open desert scrubland with no trees, punctuated by small active sand dunes and bare clay patches, where archaeological remains are often but not exclusively found (Markofsky et al. Reference Markofsky, Ninfo, Balbo, Conesa and Madella2017). Weather conditions are predominantly clear (little or no cloud cover), though strong winds are frequent. The remoteness of the field site meant, favorably, there were no power lines, cell-phone towers, or population centers to navigate, but as already noted, this also meant no telecommunications were possible during fieldwork (no internet troubleshooting, no Wi-Fi connection, no firmware or map updates, etc.). Under these conditions, we were able to test the drone for five days, continually optimizing protocols to suit the field conditions and research agenda. The first and second days tested manual versus automated flight paths; the latter were found to be more efficient in terms of full and accurate coverage, maximizing field time and available battery power, and avoiding general pilot fatigue. From this, we moved in the remaining three days to testing different survey polygon configurations. Here we discovered the practical problems with a single, large survey polygon, and the preferable setup of many smaller polygons to cover the same total area. One advantage to breaking up the survey to individual mission polygons, for our field conditions, proved to be greater adaptability to shifting on-the-ground conditions: we were able to adjust the compass orientation of the flight paths between flights to account for changes in intensity or direction of the wind, or as the angle of the sun changed throughout the day,
Even in good weather conditions, our pilot research revealed a few hiccups in UAV survey that required adjustment in our survey technique. One particular problem, given the sunny conditions of our survey, was the “solar vignetting,” or banding, that appeared in the post-processed orthophoto mosaic images (Agribotix 2018). This phenomenon is caused by the angle of the sun relative to the drone's camera as it flies back and forth along the predetermined flight paths, where consistent but differently shadowed images are stitched into a photomosaic that appears to show undulating topography when in fact there is none. If sunny conditions prevail, and time allows, the simplest work-around for the vignetting problem is to re-fly the mission from different angles and with different overlap settings; oversampling each piece of ground gives the post-processing software more imagery with which to balance the shadow effects.
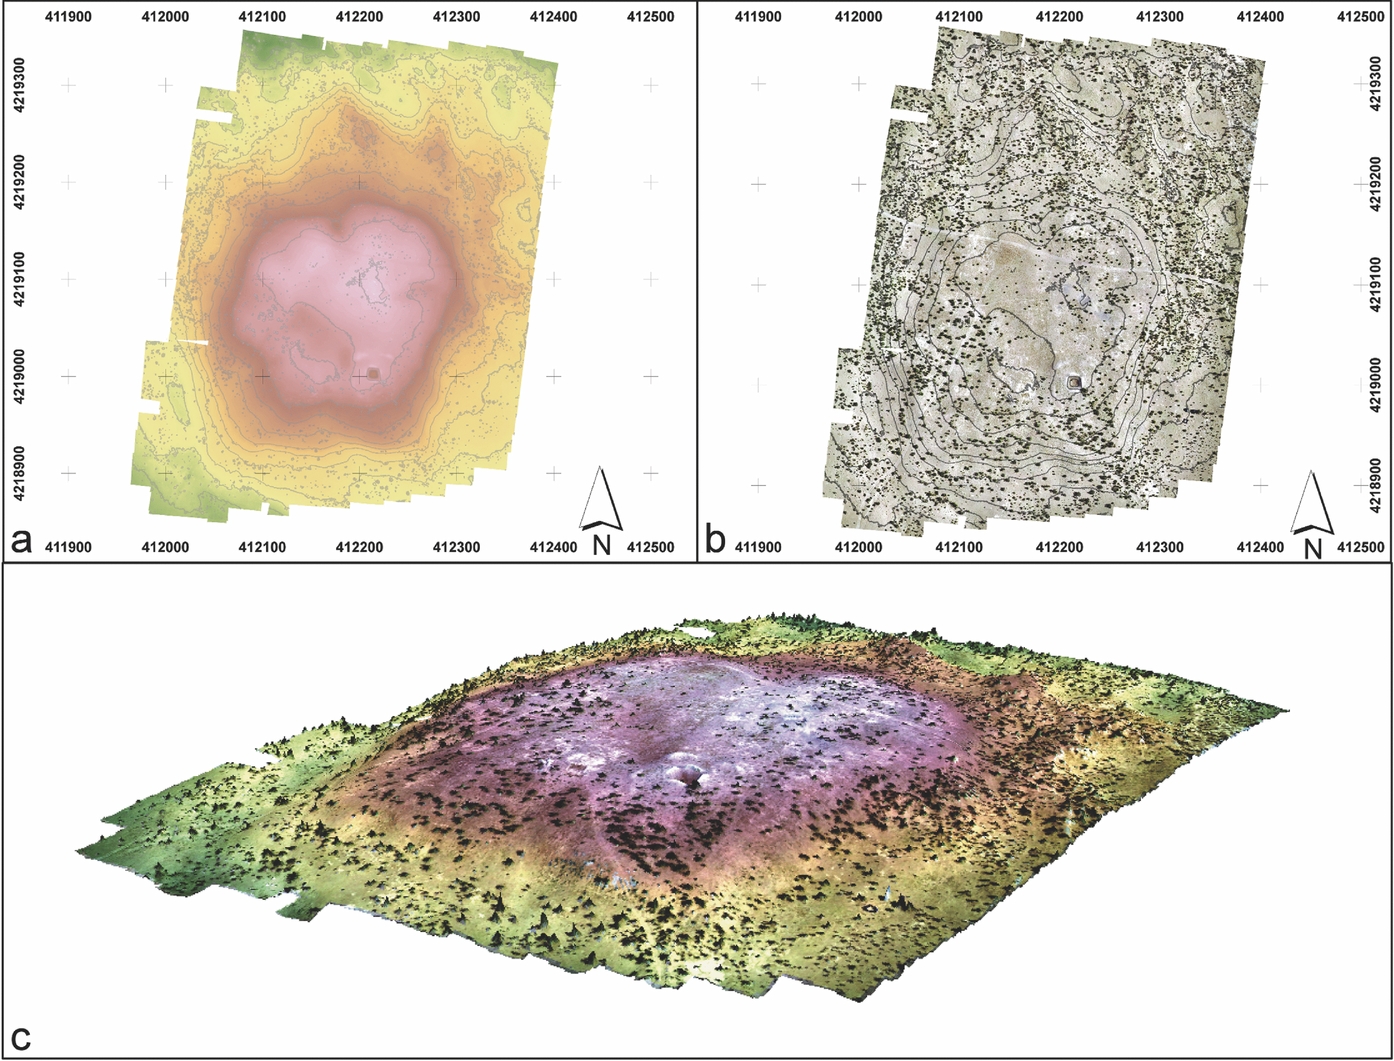
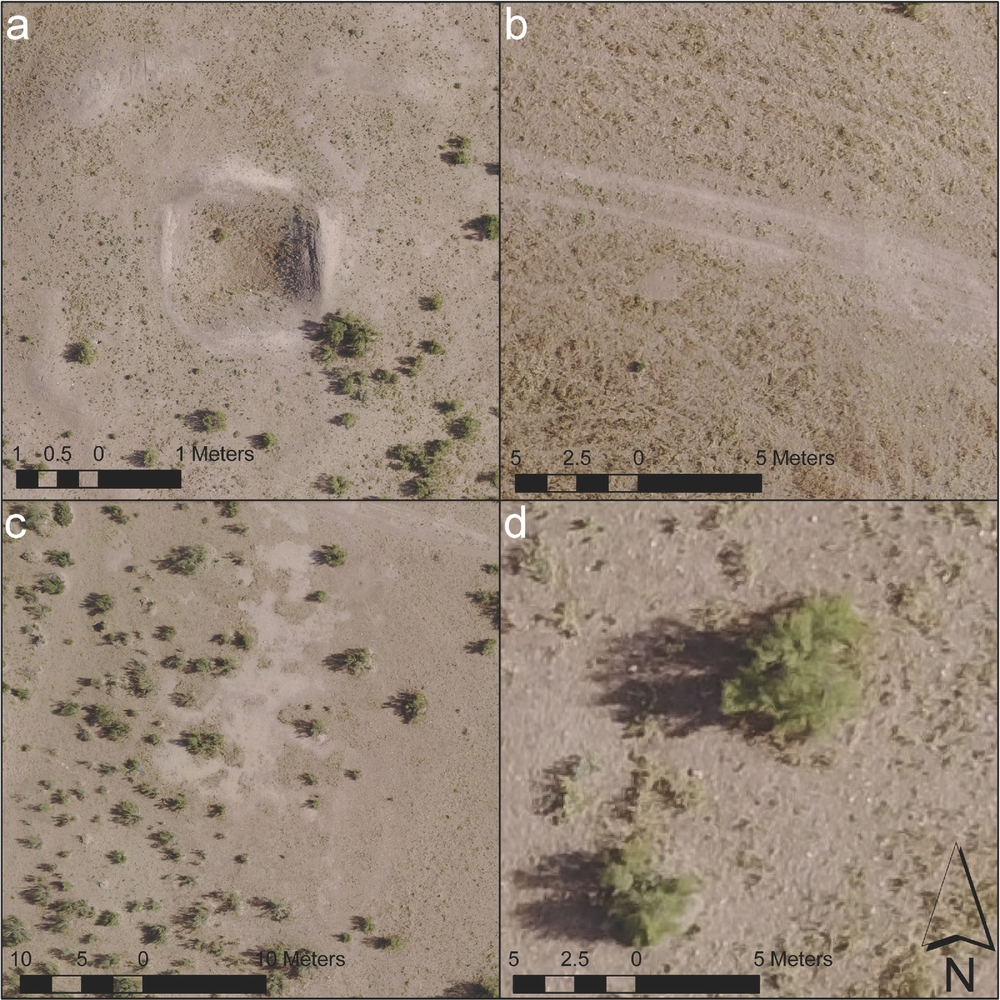
Ultimately, once we had optimized the software parameters and setup/execution workflow for our project, we were able to cover the occupation mound in a single flight (Table 6). The images captured from 60 m altitude, 65%/60% flight path overlap, proved sufficient to generate a DEM (Figure 5a) and orthophoto mosaic (overhead plan; Figure 5b) measuring approximately 400 × 600 m. We generated these in PhotoScan using the “Medium” setting for Photo Alignment, and “High” for Dense Cloud and Mesh Generation, which proved sufficient for mesoscale analysis of the site's environment. Based on these images (or more precisely, the overlap in these images), we generated a DEM with a resolution of 3.84 cm/px. This model proved accurate at identifying minute elevation changes, including previous excavation trenches on top of the mound visible in Figure 6a. The orthophoto mosaic has a resolution of 1.92 cm/px; this makes it quite possible to recognize the changes in land cover observed during pedestrian survey, such as dirt roads and worn-in livestock paths (Figure 6b) and sand versus dry riverbed (Figure 6c). Individual bushes are recognizable in the orthophoto (Figure 6d), as are ceramic scatters with more than a few sherds, though the image resolution is not high enough to recognize individual sherds by ceramic type. If our research objectives required even finer resolution, this could have been achieved by manipulating a variety of different settings, including the use of a higher-resolution camera, lower flight elevations, and greater overlap percentages and by processing the models on the highest quality settings; each of these options comes with corresponding trade-offs in terms of cost and time, whose value must be judged relative to desired outcomes. Given these results, the pilot study exceeded our expectations, proving an effective and accurate way to map surface features across a dense archaeological landscape, an objective critical to ongoing and future research in the region.
TABLE 6. Record of Flights from the 2017 PAM Season That Resulted in the Creation of a Model.
Note: Asterisks indicate flights that were processed together resulting in a single model. Figures 5 and 6 in this article were derived from 2017-May-19 Flight 1. The remaining flights and models documented the catchment around Togolok 1, extending to total coverage of approximately 1 km2, as well as reconnaissance flights over palaeochannels.

FIGURE 5. Digital elevation model (DEM) and orthophoto mosaic of Togolok 1 North, May 2017: (a) DEM, (b) orthophoto, and (c) 2.5D composite topo-photomosaic model.

FIGURE 6. Details of topographic features identified in the models: (a) old excavation trenches and backfill, (b) tire tracks and livestock paths, (c) distinction between bare clay ground surface (takyr) and sand cover, and (d) individual bushes.
Discussion
This article addresses an increasingly common field methodology in archaeological research, which is likely to attract more entry-level users in the coming years. The models that can be generated using quadrotor UAV systems—namely, orthophoto mosaics and digital elevation models—are today deployed in a diverse array of applications. These include but are not limited to conjunctions with other forms of geospatial data and geostatistical analyses, as well as the production of thematic and interpretive maps (Brenningmeyer et al. Reference Brenningmeyer, Kourelis, Katsaros, Campana, Scopigno, Carpentiero and Cirillo2016; Cantoro et al. Reference Cantoro, Tsigonaki, Armstrong, Sarris, Campana, Scopigno, Carpentiero and Cirillo2016; De Reu et al. Reference De Reu, Trachet, Laloo and De Clerq2016; Fernández-Lozano and Gutiérrez-Alonso Reference Fernández-Lozano and Gutiérrez-Alonso2016; Sonnemann et al. Reference Sonnemann, Malatesta, Hofman, Forte and Campana2016). Provided that the models exhibit sufficient spatial fidelity and geospatial accuracy, they can be used to measure architectural and landscape features (Wernke et al. Reference Wernke, Adams and Hooten2014). They can also be used for routine site and landscape monitoring (Rinaudo et al. Reference Rinaudo, Chiabrando, Lingua and Spano2012; Seitz and Altenbach Reference Seitz and Altenbach2011), heritage documentation (Harrison-Buck et al. Reference Harrison-Buck, Willis and Walker2016; Wechsler et al. Reference Wechsler, Lipo, Lee and Hunt2016), and the detection of looting or other forms of heritage destruction (Fiorillo et al. Reference Fiorillo, Fernández-Palacios, Remondino and Barba2013; Hill et al. Reference Hill, Rowan and Kersel2014; Howland et al. Reference Howland, Kuester and Levy2014; Kersel and Hill Reference Kersel and Hill2015).
The rudiments of quadrotor aerial survey we present here provide practical guidance to researchers at the beginning stages of integrating UAV systems into research design. The considerations discussed here should be of wide utility to research projects interested in documenting remote, mesoscale archaeological landscapes, and the basic workflow and equipment kit described can be adapted to a variety of different research priorities. In combination with additional project-relevant examples drawn from the ever-expanding UAV archaeological literature, this article can frame sophisticated research designs and allow even relative beginners to produce technical quality orthophoto mosaics and DEMs. Using the strategies presented in this article, a flight team can reasonably cover between 10 and 50 ha in one day, depending on flight parameters and battery rotation. While this is considerably less than what may be accomplished with larger-format UAV platforms (see Eisenbeiß Reference Eisenbeiß2009), it does mean that between 0.5 and 2.5 km2 can be covered during a single week of fieldwork, depending on weather conditions. The primary benefits of this quadrotor-UAV method are in the speed with which it may be deployed, the cost effectiveness of the platform and software, and the ease with which it can be implemented. The final products obtained from this protocol—orthophotos and DEMs—represent considerable improvements over freely available satellite imagery such as ASTER and CORONA and can be obtained (and updated) at a fraction of the cost of high-resolution imagery available commercially.
CONCLUSION
In the past decade, the use of UAV systems in archaeological field research has gone from being the domain of technical specialists to being available, accessible, and usable by nearly anyone. The opening up of this technology to a mass-market audience has led to a period of widespread adoption and experimentation with UAV systems, though particularly with small electric rotary platforms such as quadcopters. These devices have a wide array of potential applications in the field, but they are particularly useful when used in conjunction with photogrammetric software to produce orthophotos and the generation of digital elevation models for the 3D documentation of everything from excavation units and small monuments, to site mapping and landscape-scale documentation. With the continued advancement in miniaturization of camera lenses and further development of increasingly accurate on-board global positioning systems, such UAV platforms will continue to improve our ability to quickly and accurately produce high-resolution orthophotos and 3D models in the field.
We would like to encourage practitioners to experiment with different platforms. While “out-of-the-box” systems are an excellent solution to the practical problem of inadequate terrain models and aerial imagery, there are other problems that such UAVs may be well positioned to solve. We have demonstrated here that even nonspecialists can quickly learn to use drones in the field and produce high-quality output, which represents an exciting horizon of possibility for the discipline. We do advocate, however, for continued collaboration with specialists in the field of geomatics and remote sensing to further push our practice forward into new domains.
Acknowledgments
Fieldwork discussed in this article was carried out in collaboration with the Ministry of Culture of Turkmenistan, within the scope of the Project for the Ancient Murghab (PAM) directed by Lynne Rouse. In particular, the authors thank Mukhammed Mamedov and Recep Jepbarov for their thorough support of the fieldwork during which UAV protocol was tested. Thanks are also extended to the staff of the U.S. Embassy in Ashgabat for helping arrange the logistics of drone fieldwork, and to the other members of the 2017 field team: Roberto Arciero, Nikolaus Boroffka, and Élise Luneau. We also thank Peter Cobb, Yuqi Li, and three anonymous reviewers for their helpful comments and suggestions at several stages of the drafting of the manuscript. Lastly, thanks go to Maria Fernanda Esteban Palma for providing the Spanish-language abstract.
Data Availability Statement
The data used to construct the hardware and software tables in this article are freely available on the web, as are the Agisoft PhotoScan tutorials and the coded ground control markers mentioned in the text. The unmanned aerial vehicle photographs used to create the DEM and orthophoto mosaic presented in the article are restricted from open public access by the terms of the research agreement under which fieldwork was conducted.