


Significant outcomes
∙ Spine density in the medial prefrontal cortex and hippocampus in the susceptible mice was lower than control mice.
∙ Spine density in the nucleus accumbens and ventral tegmental area (VTA) in the susceptible mice was higher than control mice.
∙ Regional differences in spine density may contribute to stress resilience.
Limitations
∙ We did not measure the synaptic proteins that are involved in stress susceptibility.
Introduction
Humans display wide variability in their response to psychological stress. Multiple lines of evidence suggest that stress resilience is mediated by adaptive changes in several neural circuits involving numerous neurotransmitter and molecular pathways (Reference Feder, Nestler and Charney1,Reference Russo, Murrough, Han, Charney and Nestler2). Although the understanding of the molecular mechanism underlying stress resilience can facilitate the development of therapeutic drugs for stress-related psychiatric disorders including depression, the precise mechanisms underlying stress resilience remain unknown.
Stress can have a long-lasting deleterious impact on the structure and function of brain circuit, resulting in long-lasting alterations in the behaviours. A number of studies demonstrated that chronic stress causes alterations in the size or volume of cortical and limbic brain structures implicated in depression as well as the number of dendritic spine density in the brain regions (Reference Duman and Duman3–Reference Nestler and Hyman6). The brain regions such as prefrontal cortex (PFC), hippocampus, amygdala, and nucleus accumbens (NAc) are highly plastic regions that undergo morphological changes as a result of stress exposure. Chronic social defeat stress (CSDS) has been widely used as an animal model of depression (Reference Nestler and Hyman6). In the CSDS, ~30% is resilience. We previously reported abnormalities in the dendritic spine density in the brain regions, including medial PFC (mPFC), CA3 and dentate gyrus (DG) of hippocampus, and NAc of susceptible mice after CSDS (Reference Dong, Zhang and Yao7–Reference Yao, Zhang and Ishima10). However, there are no reports showing the role of dendritic spine density in the brain regions in resilient mice after CSDS.
In the present study, we examined whether dendritic spine density in the brain regions of susceptible and resilient mice after CSDS was altered compared with control mice because changes in dendritic spine density in the mPFC, hippocampus, NAc and VTA are believed to contribute to the pathogenesis of depression (Reference Duman and Duman3,Reference Ohgi, Futamura and Hashimoto4,Reference Nestler and Carlezon11,Reference Zhang, Yao and Hashimoto12).
Materials and methods
Animals
Male adult C57BL/6 mice, aged 8 weeks (body weight 20–25 g; Japan SLC Inc., Hamamatsu, Japan) and male adult CD1 (ICR) mice, aged 13–15 weeks (body weight >40 g, Japan SLC Inc.) were used. Animals were housed under controlled temperatures and 12 h light/dark cycles (lights on between 07:00 a.m. and 19:00 p.m.), with ad libitum food (CE-2; CLEA Japan Inc., Tokyo, Japan) and water. The study was approved by the Chiba University Institutional Animal Care and Use Committee.
CSDS model
The procedure of social defeat stress was performed as previously reported (Reference Dong, Zhang and Yao7–Reference Yao, Zhang and Ishima10). Every day the C57BL/6 mice were exposed to a different CD1 aggressor mouse for 10 min, total for 10 days. When the social defeat session ended, the resident CD1 mouse and the intruder mouse were housed in one half of the cage separated by a perforated Plexiglas divider to allow visual, olfactory, and auditory contact for the remainder of the 24-h period. At 24 h after the last session, all mice were housed individually. On day 11, a social interaction test was performed to identify subgroups of mice that were susceptible and unsusceptible (resilience) to social defeat stress. This was accomplished by placing mice in an interaction test box (42×42 cm) with an empty wire-mesh cage (10×4.5 cm) located at one end. The movement of the mice was tracked for 2.5 min, followed by 2.5 min in the presence of an unfamiliar aggressor confined in the wire-mesh cage. The duration of the subject’s presence in the ‘interaction zone’ (defined as the 8-cm-wide area surrounding the wire-mesh cage) was recorded by a stopwatch. The interaction ratio was calculated as time spent in an interaction zone with an aggressor/time spent in an interaction zone without an aggressor. An interaction ratio of 1 was set as the cutoff: mice with scores <1 were defined as ‘susceptible’ to social defeat stress and those with scores ≥1 were defined as ‘unsusceptible (resilience)’.
Sucrose preference test (SPT)
The procedure of SPT was performed as previously reported (Reference Dong, Zhang and Yao7–Reference Yao, Zhang and Ishima10,Reference Zhang, Yao and Dong13,Reference Ren, Ma and Ishima14). Mice were exposed to water and 1% sucrose solution for 48 h, followed by 4 h of water and food deprivation and a 1 h exposure to two identical bottles, one is water, and another is 1% sucrose solution. The bottles containing water and sucrose were weighed before and at the end of this period and the sucrose preference was determined.
Golgi staining
Golgi staining was performed using the FD Rapid GolgiStainTM Kit (FD Neuro Technologies Inc., Columbia, MD, USA) according to our previous reports (Reference Dong, Zhang and Yao7–Reference Yang, Shirayama and Zhang9,Reference Yang, Shirayama, Zhang, Ren and Hashimoto15–Reference Zhang, Yao and Dong17). Briefly, mice were deeply anesthetised using isoflurane, and the brain was removed from the skull and immersed in the impregnation solution, consisting of equal volumes of Solutions A and B, for 2 weeks in the dark. Then, brain tissues were transferred to Solution C and stored in fresh solution at 4°C for 1 week. Coronal brain sections (100-μm thickness) were cut on a cryostat (3050S; Leica Microsystems AG, Wetzlar, Germany) with the chamber temperature set at −20°C. Each section was mounted in Solution C on saline-coated microscope slides and then dried naturally at room temperature. Dendrites within the prelimbic (PrL) and infralimbic (IL) regions of medial prefrontal cortex (mPFC), NAc (shell and core), CA1 and CA3 regions, and DG of the hippocampus, and VTA were imaged using a 100× objective with a Keyence BZ-9000 Generation II microscope (Osaka, Japan). The atlas of the rat brain given by Paxinos and Watson (Reference Paxinos and Watson18) was used to determine these brain regions. For spine density measurements, all clearly evaluable areas containing 50–100 μm of secondary dendrites from each imaged neuron were used. We chose an area ~200 μm from the soma. Three neurons/section and three sections/animal were analysed.
Statistical analysis
The data have been presented as the mean±standard error of the mean (SEM). Analysis was performed using PASW Statistics 20 (formerly SPSS statistics; SPSS, Tokyo, Japan). Comparisons between groups were performed by one-way analysis of variance (ANOVA), followed by a post hoc Tukey’s test. The p<0.05 was considered statistically significant.
Results
One day after CSDS, we divided the susceptible or resilient groups by the evaluation of the time of mice in the interaction zone (Fig. 1a and Supplementary Table S1). In social interaction test, susceptible (but not resilient) group significantly had decreased ratio of the time of interaction zone (target) to the time of interaction zone (non-target) compared with control group [F(2,21)=42.287, p<0.001] (Fig. 1b). In 1% SPT, sucrose preference of susceptible group was significantly lower than those of control and resilience groups [F(2,21)=14.770, p<0.001] (Fig. 1c).
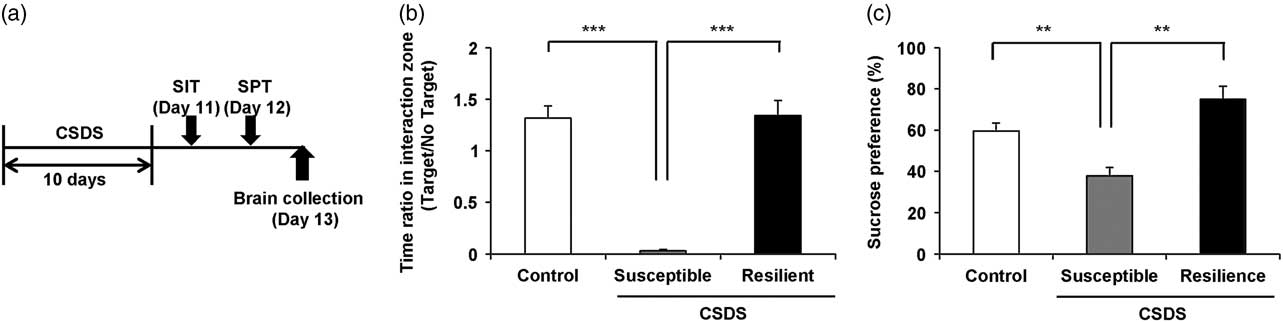
Fig. 1 Schedule of chronic social defeat stress (CSDS) and behavioural data. (a) The schedule of social defeat stress model, social interaction test (SIT) and brain collection. SIT was performed on day 11. SPT was performed on day 12. Brains from all mice were collected on day 13. Control, susceptible, and resilient mice were used for analysis of dendritic spine density. (b) Duration of mice in the interaction zone without presence of aggressive CD1 mice. (c) Duration of mice in the interaction zone in the presence of aggressive CD1 mice. Data are shown as mean±SEM (n=8) **p<0.01, ***p<0.001 compared with the susceptible group of CSDS group. CSDS, chronic social defeat stress.
One-way ANOVA was performed to analyse the results of spine density in the PrL of mPFC [F(2,21)=19.241, p<0.001], IL of mPFC [F(2,21)=0.102, p=0.904], NAc-shell [F(2,21)=11.918, p<0.001], NAc-core [F(2,21)=8.304, p=0.002], CA1 region [F(2,21)=0.656, p=0.529], CA3 region [F(2,21)=9.411, p=0.001], DG [F(2,21)=21.855, p<0.001], VTA [F(2,21)=32.329, p<0.001] among the three groups. Post hoc analyses demonstrated that the spine density in the PrL of mPFC, CA3, and DG was significantly lower in the susceptible group than in the control and resilience groups (Figs 2a, f, and g). Conversely, the spine density in the NAc (shell and core) and VTA was significantly higher in the susceptible group than in the control group, whereas the spine density in the NAc (shell and core) and VTA was not altered in the resilient group (Figs 2c, d, and h). The spine density in the IL area of mPFC and CA1 region of hippocampus was not altered among the three groups (Figs 2b and e).
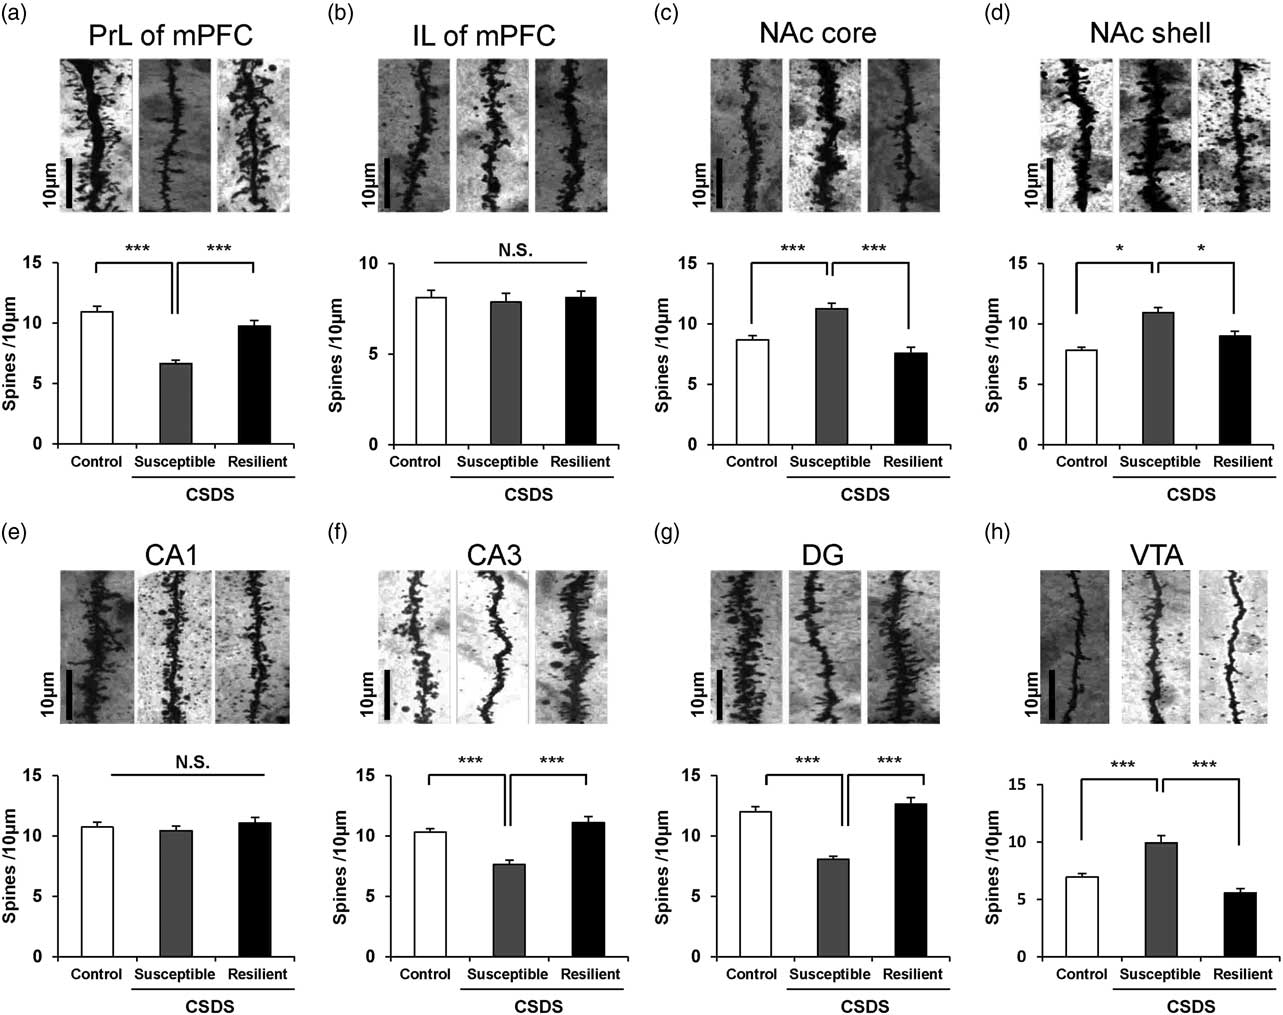
Fig. 2 Dendritic spine density in the brain regions of control, susceptible, and resilient mice after chronic social defeat stress (CSDS). Golgi staining in the mouse brain of control, susceptible, and resilient groups was performed. Spine density in the prelimbic (PrL) area of mPFC, infralimbic (IL) area of mPFC, NAc-shell, NAc-core, CA1, CA3, and DG (dentate gyrus) of hippocampus, and ventral tegmental area (VTA) was measured. Data are shown as mean±SEM (n=8) *p<0.05, ***p<0.001 compared to susceptible group. Scale bar=10 μm.
Discussion
In this study, we observed that dendritic spine density in the PrL of mPFC, CA3, and DG of susceptible mice after CSDS was lower than control mice, whereas dendritic spine density in the NAc and VTA of susceptible mice was higher than control mice. In contrast, there were no changes in the spine density in the all brain regions from resilient mice after CSDS. These results suggest that regional differences in dendritic spine density in the brain may contribute to resilience versus susceptibility in mice subjected to CSDS.
Changes in dendritic length and spine density in the mPFC, hippocampus, and VTA-NAc may contribute to depression-like phenotype in rodents (Reference Duman and Duman3–Reference Radley, Rocher and Miller5). In this study, we observed a decreased spine density in the PrL of mPFC, hippocampus (CA3 and DG), as well as increased spine density in the NAc (shell and core), and VTA of susceptible mice after CSDS. The alterations in spine density in the PrL of mPFC, CA3, DG, and NAc of susceptible mice observed in this study are similar to the previous reports (Reference Dong, Zhang and Yao7–Reference Yang, Shirayama and Zhang9). Although the reasons underlying the differential regulation of spine density in the mPFC and hippocampus versus VTA-NAc are currently unknown, alterations in the dendritic spine in these regions may contribute to the susceptibility and resilience to CSDS. The alterations in spine density in the mPFC, CA3, DG, and NAc of susceptible mice are also similar to the findings observed in rodents with unpredictable chronic mild stress (Reference Li, Liu and Dwyer19) and those with inflammation-induced depression (Reference Yang, Shirayama, Zhang, Ren and Hashimoto15,Reference Zhang, Wu and Fujita16). In contrast, dendritic spine density in the all brain regions was not altered in the resilient group after CSDS. Given the role of synaptogenesis in depression (Reference Duman and Duman3,Reference Ohgi, Futamura and Hashimoto4), the relationship between alterations in spine morphology after CSDS and depression-like phenotype are of great interest.
The precise molecular mechanisms underlying the loss of spines in response to chronic stress are currently unknown. Accumulating evidence suggests that brain-derived neurotrophic factor (BDNF) and its receptor TrkB signalling in the PFC and hippocampus plays an important role in modulating stress-induced dendritic changes and depression-like behaviours (Reference Duman and Duman3,Reference Ohgi, Futamura and Hashimoto4,Reference Zhang, Yao and Hashimoto12,Reference Yang, Shirayama, Zhang, Ren and Hashimoto15,Reference Zhang, Wu and Fujita16,Reference Ren, Ma and Yang20,Reference Shirayama, Yang and Zhang21). Previously, we reported that the TrkB agonist 7,8-dihydroxyflavone (7,8-DHF) showed antidepressant effects by normalising decreased spine density in the PFC, CA3, and DG after inflammation (Reference Zhang, Wu and Fujita16). Furthermore, we reported that 7,8-DHF showed antidepressant effects by normalising decreased synaptogenesis in the PFC, CA3, and DG of susceptible after learned helplessness (LH) (Reference Shirayama, Yang and Zhang21). Moreover, we reported that the N-methyl-D-aspartate receptor antagonist (R)-ketamine showed antidepressant effects by normalising decreased spine density and BDNF levels in the PFC, CA3, and DG of susceptible after CSDS (Reference Yang, Shirayama and Zhang9), suggesting a role of BDNF–TrkB signalling in the (R)-ketamine’s antidepressant actions. In addition, Taliaz et al. (Reference Taliaz, Loya and Gersner22) reported that hippocampal BDNF expression plays a critical role in the resilience to chronic mild stress. The expression of BDNF mRNA and protein in brain regions is dependent on the time after chronic stress exposure (Reference Naert, Ixart, Maurice, Tapia-Arancibia and Givalois23). Taken together, it is likely that decreased BDNF–TrkB signalling in the PFC and hippocampus plays a key role in depression-like phenotype after CSDS.
The VTA-NAc pathway plays a key role in the pathophysiology of depression (Reference Nestler and Carlezon11,Reference Zhang, Yao and Hashimoto12,Reference Zhang, Wu and Fujita16). We reported that the TrkB antagonist ANA-12 showed antidepressant effects by normalising increased spine density in the NAc after inflammation (Reference Zhang, Wu and Fujita16). We also reported that ANA-12 showed antidepressant effects by normalising increased spine density in the NAc of susceptible mice after LH (or CSDS) (Reference Zhang, Yao and Dong13,Reference Shirayama, Yang and Zhang21). Furthermore, we also observed increased BDNF levels and spine density in the NAc of LH rats, but not in that of resilience rats, after LH (Reference Yang, Shirayama, Zhang, Ren and Hashimoto15), suggesting a role of BDNF in stress resilience. Moreover, we found that expression of proBDNF and BDNF pro-peptide in the mPFC of LH rats, but not non-LH (resilient) rats, was higher than control rats, although expression of these proteins in the NAc of LH rats was significantly lower than control rats (Reference Yang, Yang and Ren24). This study suggests that regional differences in conversion of BDNF precursors into BDNF and BDNF pro-peptide by proteolytic cleavage may contribute to stress resilience (Reference Yang, Yang and Ren24). Taken together, it is likely that increased BDNF levels and spine density in the VTA-NAc circuit may contribute to depression-like phenotype after CSDS. Because of the key role of BDNF–TrkB signalling in VAT-NAc circuit in the pathogenesis and therapeutic mechanisms of depression (Reference Nestler and Carlezon11,Reference Zhang, Yao and Hashimoto12,Reference Ren, Ma and Yang20), the regional differences in the alterations of dendritic spine density in susceptible and resilient mice may also contribute to resilience to CSDS. Finally, we recently reported that altered composition of gut-microbiota contributes to stress resilience after CSDS, suggesting a role of gut-microbiota-brain axis in stress resilience (Reference Yang, Fujita and Ren25). Further detailed studies on the role of gut-microbiota in stress resilience are needed.
In conclusion, this study suggests that differential alterations in dendritic spine density in brain regions, including the PrL of mPFC, CA3, DG, NAc, and VTA, may contribute to resilience versus susceptibility in mice subjected to CSDS.
Acknowledgements
This study was supported by the Strategic Research Program for Brain Sciences from Japan Agency for Medical Research and Development, AMED (to K.H.). Dr. Chun Yang and Dr. Qian Ren and were supported by Research Fellowship of the Japan Society for the Promotion of Science (Tokyo, Japan). Ms. Min Ma was supported by the Nurture of Creative Research Leaders in Immune System Regulation and Innovative Therapeutics Program of Chiba University. Dr. Chao Dong was supported by the Uehara Research Foundation (Tokyo, Japan).
Authors’ Contribution: Y.G.Q. for substantial contributions to conception and design, acquisition of data, analysis and interpretation of the data, drafting the article, and final approval of the version to be published; C.Y., Q.R., M.M., and C.D. for substantial contributions to conception and design, final approval of the version to be published; K.H. for substantial contributions to conception and design, acquisition of data, analysis and interpretation of the data, drafting the article, and final approval of the version to be published.
Conflicts of Interest
The authors report no biomedical financial interests or potential conflicts of interest.
Ethical Standards
The experimental procedure was approved by the Animal Care and Use Committee of Chiba University. The authors assert that all procedures contributing to this work comply with the ethical standards of the relevant national and institutional guides on the care and use of laboratory animals.
Supplementary Material
To view supplementary material for this article, please visit https://doi.org/10.1017/neu.2017.16


