


Significant outcomes
Unipolar major depression is characterised by a decrease in anterior cingulate cortex grey matter explaining, in part, aberrations in cognitive and affective regulation, attention, problem-solving, motivation and decision-making.
Unipolar major depression is characterised by decreases in orbitofrontal cortex grey matter explaining aberrations in social and emotional behaviours including the processing of rewards and punishment.
Limitations
The bipolar disorder study sample was relatively small.
Recently, major biological differences were detected between BD1 and BD2 patients, and therefore, future research should also examine differences among both BD subtypes.
Enhanced neuro-oxidative pathways with neurodegenerative effects are more expressed in unipolar depressed than in bipolar patients, and therefore, future research should examine decreased grey matter volume in mood disorders in association with neuro-oxidative pathways.
Introduction
Depression is one of the most common psychiatric disorders with increasing frequency and immense social and economic burden (Sartorius, Reference Sartorius2001). The clinical representation encompasses affective, cognitive and somatic complaints such as low mood, anxiety, lack of pleasure and interest, disturbances of sleep and appetite, decreased self-esteem and thoughts of guilt, hopelessness and even suicide. Although important insights into the underlying pathophysiological mechanisms have been gained through recent advances in both structural and functional neuroimaging, many issues remain unresolved (Drevets et al., Reference Drevets, Price and Furey2008; Sacher et al., Reference Sacher, Neumann, Funfstuck, Soliman, Villringer and Schroeter2012).
One such major problem is the question of whether and to what extent depression causes structural changes in the brain. The majority of individual studies and meta-analyses published in this field are positive about grey matter (GM) volume reductions in various cortical regions in depressed patients (unipolar and bipolar alongside) compared to healthy controls (Koolschijn et al., Reference Koolschijn, van Haren, Lensvelt-Mulders, Hulshoff Pol and Kahn2009; Bora et al., Reference Bora, Fornito, Yucel and Pantelis2010; Arnone et al., Reference Arnone, McIntosh, Ebmeier, Munafo and Anderson2012; Lai, Reference Lai2013). The most consistent findings appear to be related to GM loss in medial frontal cortex (MFC), anterior cingulate cortex (ACC) and orbitofrontal cortex (OFC), with less evidence about subcortical structures such as the amygdala and hippocampus (Koolschijn et al., Reference Koolschijn, van Haren, Lensvelt-Mulders, Hulshoff Pol and Kahn2009; Kempton et al., Reference Kempton, Salvador, Munafò, Geddes, Simmons and Frangou2011; Lai & Wu Reference Lai and Wu2014; Zhao et al., Reference Zhao, Du, Huang, Lui, Chen and Liu2014; Arnone et al., Reference Arnone, Job, Selvaraj, Abe, Amico and Cheng2016). Nevertheless, a number of studies have failed to detect some regional changes in GM volume (for instance, ACC) while confirming others (OFC) (Brambilla et al., Reference Brambilla, Nicoletti, Harenski, Sassi, Mallinger and Frank2002; Bremner et al., Reference Bremner, Vythilingam, Vermetten, Nazeer, Adil and Khan2002).
In addition, the exact localisation (bilateral, left or right) and the extent of GM reductions reported often varies from one study to another. For instance, the meta-analysis by Lai (Reference Lai2013) detected GM loss in bilateral ACC while Arnone et al. Reference Arnone, McIntosh, Ebmeier, Munafo and Anderson(2012) demonstrated a decrease only in the right ACC in major depression. Bipolar depression, on the other hand, appears to affect the left ACC (Bora et al., Reference Bora, Fornito, Yucel and Pantelis2010). Similar controversies exist about the reduction of GM in OFC spanning from bilateral engagement of its medial and lateral parts to only left- or right-sided loss (Koolschijn et al., Reference Koolschijn, van Haren, Lensvelt-Mulders, Hulshoff Pol and Kahn2009; Arnone et al., Reference Arnone, McIntosh, Ebmeier, Munafo and Anderson2012; Schmaal et al., Reference Schmaal, Hibar, Sämann, Hall, Baune and Jahanshad2017).
These and other inconsistencies can be explained by the heterogeneity of patient samples (unipolar vs bipolar depression, severity, psychotic features, remission, medication status), variability of the image acquisition parameters and flexibility of the methods employed [a priori-defined regions of interest (ROIs) or whole brain analysis such as voxel-based morphometry (VBM)].
We have assumed that in many cases ‘unipolar’ depression, as defined in major depressive disorder (MDD), might be interpreted within the context of the bipolar spectrum(Angst & Gamma, Reference Angst and Gamma2002; Ghaemi, Reference Ghaemi2013; Haralanov et al., Reference Haralanov, Haralanova, Terziivanova, Moeller and Hennig-Fast2015), especially when the hypomanic episodes have manifested on sub-threshold, latent or mixed syndrome level (Haralanov et al., Reference Haralanov, Haralanova, Terziivanova, Moeller and Hennig-Fast2015; Haralanov & Terziivanova, Reference Haralanov and Terziivanova2011; Mazza et al., Reference Mazza, Mandelli, Zaninotto, Nicola, Martinotti and Harnic2011; Perlis et al., Reference Perlis, Uher, Ostacher, Goldberg, Trivedi and Rush2011), and therefore, might not have been properly registered in medical records. Despite recent efforts to understand the underlying pathophysiological mechanisms, the question of whether and to what extent mood disorders cause structural changes in the brain remains unclear.
Hence, the current study was carried out to examine a VBM study on a sample of mood disorder patients comprising depression and bipolar disorder compared to a matched group of healthy controls. Our initial hypothesis based on the findings of previous VBM studies was that we would find GM volume decreases in cortical areas related to emotion processing and cognitive functioning such as ACC, MFC and OFC. Based on this assumption we first pooled the two patient groups together and compared them to the control subjects, and subsequently, performed a separate one-way ANOVA analysis with the tree subsamples (unipolar, bipolar and healthy) to define the shared and distinct GM volume changes in patients suffering from the two major psychiatric disorders.
Methods
Subjects
For the present study we recruited 50 adult subjects (mean age 46.7 ± 13.1 y, 12 males) complying with the DSM-IV-TR criteria for depressive episodes (single or recurrent) of MDD (n=39) or bipolar disorder (n=11) and 42 age- and sex-matched healthy controls (mean age 42.6 ± 13.7 y, 13 males). All participants were assessed by a general clinical interview and the structured Mini International Neuropsychiatric Interview (M.I.N.I 6.0) (Sheehan et al., Reference Sheehan, Lecrubier, Sheehan, Amorim, Janavs and Weiller1998). Montgomery–Åsberg Depression Rating Scale (MADRS) (Montgomery & Asberg, Reference Montgomery and Asberg1979) was used for the assessment of severity. Subjects were excluded if they had a second axis-I diagnosis (psychotic, anxiety, substance-related disorder) or severe suicidal risk (10th item of MADRS ≥2).
Healthy controls did not comply with any of the DSM-IV-ТR diagnoses included in the M.I.N.I. and had no history of any psychiatric disorder. Exclusion criteria for both patients and healthy controls included major medical illness, neurological disease and history of head trauma with loss of consciousness. All participants provided a written informed consent complying with the Declaration of Helsinki, and the study was approved by the University’s Ethics Committee (P-1369/29.05.2015).
MRI acquisition and analysis
High-resolution structural scans Sag 3D T1 FSPGR sequences were obtained from all participants on a 3Т MRI system (GE Discovery 750w) with the following parameters: 1-mm slice thickness, 256 × 256 matrix, 7.2 ms relaxation time (TR), 2.3 ms echo time (TE) and 12° flip angle.
MRI data were analysed using the SPM 12 (Statistical Paramertic Mapping, http://www.fil.ion.ucl.ac.uk/spm/) software running on MATLAB R2017 for Windows and the CAT 12 toolbox implemented in SPM (http://www.neuro.uni-jena.de/software/). The preprocessing included the following steps: (i) segmentation through the CAT 12 toolbox, including normalisation to standardised MNI (Montreal Neurological Institute) space, followed by (ii) spatial smoothing with an 8-mm full-width-at-half-maximum Gaussian kernel. Total intracranial volume was also calculated. For statistical analysis, two general linear models were defined. First, we compared the GM volume between the two groups (patients and controls) with a two-sample t-test. Next, an ANOVA model was specified that further differentiated between subjects with MDD, subjects with bipolar disorder, and healthy control subjects. All statistical models included the total intracranial volume as a covariate, and all results were explored with an False Discovery Rate (FDR)-corrected threshold of p<0.05 (false discovery rate) and an extent threshold of at least 36 voxels per cluster (expected voxels per cluster).
Statistical analysis
We performed a statistical analysis of the demographic and clinical characteristics of the participants using SPSS 22.0 for Windows. The level of significance was set to p<0.05 for all tests. Student’s t-test was applied for continuous variables and Chi-square test for categorical variables.
Results
Demographic and clinical characteristics
There were no statistically significant differences in age, sex and education level between the patients and the healthy controls. Expectedly, patients had significantly higher MADRS scores. Clinical characteristics of the patient sample are given in detail in Table 1. The two patient groups did not differ significantly in demographic and clinical variables (Table 2).
Table 1. Demographic and clinical characteristics of all the participants

SD – Standard Deviation,a Independent samples t-test,b χ2 – test, MADRS – Montgomery–Åsberg Depression Rating Scale, * p<0.05.
Table 2. Demographic and clinical characteristics of the two patient groups

SD – Standard Deviation,a Independent samples t-test,b χ2 - test, MADRS – Montgomery–Åsberg Depression Rating Scale, * p<0.05, N – number of patients, MDD – major depressive disorder, BD – bipolar disorder, SSRIs – selective serotonin reuptake inhibitors, SNRIs – serotonin noradrenalin inhibitors, TCAs – tricyclic antidepressants.
VBM
First, we performed a two-sample t-test on GM images with the total intracranial volume, age and sex as covariates. The contrast between controls and patients yielded significant differences in clusters encompassing left MFC and ACC as well as right frontal and temporal regions (p(FDR)<0.05). The results are described in detail in Table 3 and an illustration is given in Fig. 1. The reverse contrast exploration did not produce any surviving significant clusters.
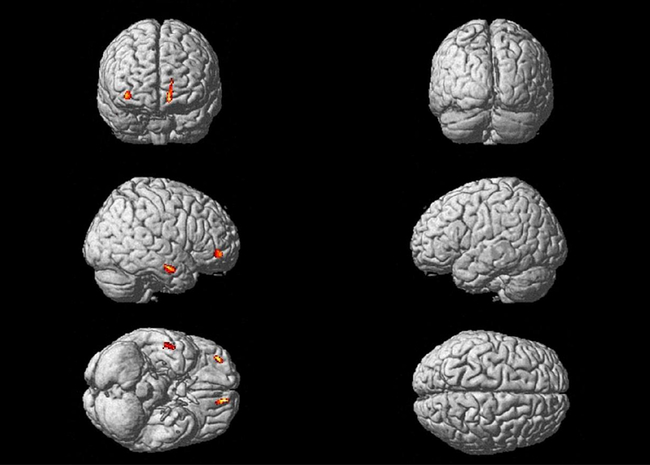
Fig. 1. Clusters significantly reduced in all patients compared to controls.
Table 3. Clusters of GM volumes significantly reduced in all patients compared to healthy controls

In addition, a one-way ANOVA model differentiated between the two patient groups (unipolar and bipolar) and the control subjects with the total intracranial volume, age and sex as covariates. Significant difference was found between healthy controls and subjects with major depression again in a single cluster (297 voxels, p=0.04) located to the left MFC and left ACC while frontal and temporal clusters did not survive FDR correction but demonstrated a trend towards significance – see Table 4 for details. The contrast between controls and bipolar patients as well as the between the two patients’ groups did not reach statistical significance.
Table 4. Clusters of GM volumes significantly reduced in MDD patients compared to healthy controls

Discussion
The results of the present study suggest that patients with mood disorders (unipolar and bipolar depression combined) demonstrate significant decreases in GM volume restricted to regions located in MFC and ACC on the left side and middle frontal gyrus, medial orbital gyrus, inferior frontal gyrus (triangular and orbital parts) and middle temporal gyrus (extending to the superior temporal gyrus) on the right side. Nevertheless, when the patient group was divided into bipolar and unipolar depression, the reductions remained significant only for unipolar depression patients. These findings replicate some of the previous morphometric individual and meta-analytic studies on depression and their significance will be discussed below.
The biggest cluster showing reduction of GM in the patient group in our study was situated in MFC and ACC. Accordingly, in medication-naïve MDD patients, the GM volume of the MFC was found to be significantly reduced (Lai & Wu Reference Lai and Wu2014). Similar findings with regard to ACC were reported by a number of individual studies (Ballmaier et al., Reference Ballmaier, Toga, Blanton, Sowell, Lavretsky and Peterson2004; Coryell et al., Reference Coryell, Nopoulos, Drevets, Wilson and Andreasen2005; Caetano et al., Reference Caetano, Kaur, Brambilla, Nicoletti, Hatch and Sassi2006; Tang et al., Reference Tang, Wang and Xie2007), although some negative findings have also been published (Brambilla et al., Reference Brambilla, Nicoletti, Harenski, Sassi, Mallinger and Frank2002; Bremner et al., Reference Bremner, Vythilingam, Vermetten, Nazeer, Adil and Khan2002). Moreover, a recent meta-analysis including 20 VBM studies confirmed the reduction of GM in bilateral ACC (Lai, Reference Lai2013). Left and less robust right volumetric reductions in patients with mood disorders, predominantly in those with unipolar depression, have been previously identified by Hajek et al. Reference Hajek, Kozeny, Kopecek, Alda and Hoschl(2008). A much more extensive meta-analysis based on 101 publications of structural MRI outlined the right ACC as significantly smaller in unipolar depression (Arnone et al., Reference Arnone, McIntosh, Ebmeier, Munafo and Anderson2012). Interestingly, their meta-regression analysis demonstrated that, in the left ACC, a larger effect size was associated with increasing severity of illness and later age of onset, which might explain the observed discrepancy in the literature on the laterality of the reduction in anterior cingulate GM volume.
In bipolar depression, the most prominent structural abnormality as identified by VBM is suggested to be the reduction of the left ACC according to the meta-analytical study of Bora et al., which included 660 patients and 770 healthy control subjects (Bora et al., Reference Bora, Fornito, Yucel and Pantelis2010). We might assume that in our study several factors including the heterogeneity of the patient sample (both unipolar and bipolar) and the severity of illness (moderate-to-severe depression) have contributed to the finding of significant reduction only in the left cingulate region.
The role of the ACC in depression has been implicated not only by structural but also functional studies demonstrating changes in task-related and resting-state activity (Salvadore et al., Reference Salvadore, Cornwell, Colon-Rosario, Coppola, Grillon and Zarate2009; Davey et al., Reference Davey, Harrison, Yucel and Allen2012). This brain area is involved in cognitive and affective regulation, attention, problem-solving, motivation and decision-making, and there is a general agreement on the existence of an affective and a cognitive subdivision (Bush et al., Reference Bush, Luu and Posner2000). Both have been considered to be involved in the pathophysiology of depression as the disorder manifests with affective and cognitive symptoms alongside (Jaworska et al., Reference Jaworska, Yang, Knott and MacQueen2015; Wang et al., Reference Wang, Yang, Sun, Shi and Duan2016).
The other significant clusters demonstrating reduction in GM volume in our patient group were located in the OFC. This finding is in accordance with at least two meta-analyses (Koolschijn et al., Reference Koolschijn, van Haren, Lensvelt-Mulders, Hulshoff Pol and Kahn2009; Arnone et al., Reference Arnone, McIntosh, Ebmeier, Munafo and Anderson2012) identifying the OFC as significantly reduced in depressed patients. Moreover, Arnone et al. found that the effect size of the right OFC was larger with an increasing proportion of patients medicated with antidepressants and antipsychotics while the duration of illness was associated with smaller effect size (Arnone et al., Reference Arnone, Job, Selvaraj, Abe, Amico and Cheng2016). In addition, metabolic and functional studies have consistently provided evidence for disturbances in this area as characteristic for several psychiatric disorders and depression in particular (Drevets, Reference Drevets2007; Jackowski et al., Reference Jackowski, Araujo Filho, Almeida, Araújo, Reis, Nery and Batista2012).
As part of the prefrontal cortex, the OFC is involved in the processing of rewards and punishments which is essential for the complex emotional and social human behaviour (Kringelbach & Rolls, Reference Kringelbach and Rolls2004). A meta-analysis of functional MRI in depression has revealed increased activity of the OFC to positive emotional stimuli (Groenewold et al., Reference Groenewold, Opmeer, de Jonge, Aleman and Costafreda2013). Moreover, treatment response prediction studies suggest that this activity is normalised by antidepressants (Delaveau et al., Reference Delaveau, Jabourian, Lemogne, Guionnet, Bergouignan and Fossati2011). During reward processing, this area was found to be hypoactive in unmedicated currently depressed and in remitted patients, as well as in young individuals with familial risk for depression (McCabe et al., Reference McCabe, Cowen and Harmer2009; McCabe et al., Reference McCabe, Woffindale, Harmer and Cowen2012; Ubl et al., Reference Ubl, Kuehner, Kirsch, Ruttorf, Diener and Flor2015).
The reduction of the GM volume of a cluster in the superior/middle temporal gyrus in our study is in accordance with the recent meta-analysis of Arnone et al. Reference Arnone, Job, Selvaraj, Abe, Amico and Cheng(2016) where patients with major depression demonstrated significant GM loss in the temporal gyri bilaterally. Interestingly, significantly decreased GM volume in the right middle temporal gyrus was found in patients with suicide history compared to healthy controls (Peng et al., Reference Peng, Wu, Li, Qi, Guo and Chi2014). Similarly, in bipolar disorder, big cluster of GM reduction encompassing the insula, middle temporal gyrus, superior temporal gyrus, temporopolar area, pars opercularis and pars triangularis, inferior frontal gyrus and claustrum on the right side was identified by a recent meta-analysis (Selvaraj et al., Reference Selvaraj, Arnone, Job, Stanfield, Farrow and Nugent2012).
Dividing the patient group into bipolar and unipolar depression in our study led to a negative result for bipolar patients compared to both MDD patients and healthy controls. This is in accordance with some earlier individual and meta-analytical studies that failed to find a significant difference in GM volumes between bipolar patients and healthy subjects (McDonald et al., Reference McDonald, Zanelli, Rabe-Hesketh, Ellison-Wright, Sham and Kalidindi2004; Scherk et al., Reference Scherk, Kemmer, Usher, Reith, Falkai and Gruber2008). These findings contrast our a priori hypothesis that the GM volumes would be similarly affected in both major depressive and bipolar affective disorder. Thus, it might be beneficial to analyse these two patient groups separately but also with a sufficient sample size which is a limitation of our study since the bipolar group consists of only 11 subjects. Yet, the effect of the latent or sub-threshold bipolarity as well as the impact of the bipolar spectrum (Angst & Gamma, Reference Angst and Gamma2002) should be properly considered.
There is an increasing number of studies in the available literature that directly compare GM volumes in unipolar and bipolar depression, but their results are not consistent. One such VBM study by Cai et al. Reference Cai, Liu, Zhang and Wang(2015) detected a cluster of reduced GM volume in the middle cingulate gyrus of bipolar I patients while Chen et al. Reference Chen, Wang, Niu, Zhong, Hu and Chen(2018) reported decreases in the left superior frontal gyrus and left ACC in MDD patients. Redlich et al. Reference Redlich, Almeida, Grotegerd, Opel, Kugel and Heindel(2014), on the other hand, found reduced GM volumes in the hippocampal formation and the amygdala in BD and in the anterior cingulate gyrus in unipolar patients. The fact that we were not able to detect any difference between the two patient groups in our study might be due to several reasons including small sample size, unequal distribution of both diagnoses, diagnostic heterogeneity (bipolar I and II), medication status (most patients were medicated) or statistical threshold (the first cited article used an uncorrected p<0.001).
Conclusion
In summary, using VBM, the present study was able to replicate decreases in GM volume in frontal and temporal regions in patients with major depression and bipolar disorder compared to healthy controls. As shown by further analysis comparing the two patient groups, the abovementioned results were mainly driven by the difference between patients with major depression and healthy individuals. Future studies should examine VBM in patients with major depression and bipolar disorder separately as well as in patients with BD1 and BD2. This may improve the characterisation of structural abnormalities in mood disorders and their subtypes. Moreover, the bias of the sub-syndromal and latent forms of bipolarity should be taken into consideration and further investigations should be performed to produce accurate biological measures differentiating the two clinical diagnoses. In this respect, it is interesting to note that there are highly significant differences in neuro-oxidative pathways between unipolar depression and bipolar depression with increased damage to lipids and proteins coupled with aldehyde formation in unipolar depression as compared with BD1 and BD2 (Maes et al., Reference Maes, Bonifacio, Morelli, Vargas, Barbosa and Carvalho2019). The greater neuro-oxidative damage observed in unipolar depression may explain the greater neurodegenerative or neuroprogressive aberrations in GM volume, as detected in the present study (Maes et al., Reference Maes, Yirmyia, Noraberg, Brene, Brene, Hibbeln and Perini2009, Reference Maes, Bonifacio, Morelli, Vargas, Barbosa and Carvalho2019). To reveal the specific morphological substrate and the exact nature of the GM loss in depression longitudinal studies investigating both genetic and environmental factors will be needed.
Author ORCIDs
Michael Maes 0000-0002-2012-871X
Acknowledgements
Imaging data were acquired at the Research Complex for Translational Neuroscience, Medical University of Plovdiv and the authors would like to thank the radiographer Donka Popova for her devotion to this project. The patient recruitment was assisted by Zlatoslav Arabadzhiev, MD, PhD and valuable support has been offered by Stefan Kostyanev, MD, PhD, we are grateful to both.


