Significant outcomes
∙ Serum levels of neuropeptide Y and adrenocorticotropin hormone allow the diagnosis of patients with convulsive psychogenic non-epileptic seizures (PNES) versus healthy individuals with over 90% accuracy.
∙ Detaching the diagnosis of PNES from ictal events might be beneficial for the health care system and patient care.
Limitations
∙ Patients with PNES were significantly older than controls.
∙ Our sample size is small and composed only of women, and did not include PNES patients with non-motor symptoms.
∙ Patients with PNES were compared to healthy controls.
Introduction
Psychogenic non-epileptic seizures (PNES) resemble epileptic seizures, but without the characteristic electrical brain activity associated with epilepsy. It is estimated that the condition of PNES is diagnosed in 20–30% of patients seeking treatment for epilepsy (Reference Benbadis1). Moreover, in the general population the prevalence rate is 2–33 per 100000, making PNES nearly as prevalent as multiple sclerosis and Parkinson’s disease (Reference Devinsky, Gazzola and Lafrance2). The diagnosis of PNES is challenging because PNES and epileptic seizures share many similarities such as convulsions and/or alterations in behaviour, writhing, flailing, and whole-body thrashing as well as asynchronous, complex, and bizarre motor movements with lateral head and body turning (Reference Devinsky, Gazzola and Lafrance2,Reference Alsaadi and Marquez3). Hence, symptoms are often mistaken as signs of epilepsy, delaying the correct diagnosis for 7–10 years in some cases (4), thereby increasing the risk of exposure to medical treatments associated with potentially harmful side-effects (5).
One biomarker of convulsive events is the decreased serum brain-derived neurotrophic factor, which can be used to discriminate patients with either PNES or epilepsy from healthy controls (Reference LaFrance, Leaver, Stopa, Papandonatos and Blum6). Whereas, a specific biomarker of PNES that allows the differentiation of PNES from epilepsy is the absence of a post-ictal prolactin rise that allows the correct classification of ~89% of patients (Reference LaFrance, Baker, Duncan, Goldstein and Reuber7). However, this approach requires serial blood draw within 20 min of the suspected event and its sensitivity varies with the type of seizure, for example, tonic–clonic 60%, or complex partial 46% (Reference Chen, So and Fisher8). Alternatively, video-electroencephalography (EEG) monitoring is the gold standard for diagnosis of seizures. Even though the average accuracy of video-EEG is high, it requires specialised and expensive equipment, and typically a neurologist to interpret the results. For these reasons, video-EEG is not readily available at many hospitals (4). Another disadvantage of video-EEG is that it depends on capturing multiple convulsive episodes, increasing the cost of assessment and often causing frustration for patients.
In our previous study we detected reduced neuropeptide Y (NPY) levels in PNES patients (9). Plasma NPY levels are commonly used as a proxy for central NPY activity (Reference Sah, Geracioti and Neuropeptide10), and have been shown to modulate responses to stressful situations (Reference Southwick and Charney11) and suppress seizures (Reference Kovac and Walker12). Several studies have found that PNES may be associated with a history of stressful sexual and physical abuse (Reference Alsaadi and Marquez3,9,13) that may disturb the proper functioning of the hypothalamic–pituitary–adrenal (HPA) axis. Relying on basal serum levels, we have recently found an altered HPA activity in PNES, with higher basal levels of adrenocorticotropic hormone (ACTH) and lower cortisol levels (9). Baseline levels of ACTH, although related to epileptic but not to PNES events (Reference Zhang and Liu14), have been found higher at baseline in PNES, and appear to depend on the severity of abuse (9). In a similar way, cortisol levels are altered in response to abuse, yet the PNES-literature is far from being conclusive (9,13).
In this study, using the same blood samples collected previously (9), we present a predictive model to distinguish PNES patients from healthy adults based on serum hormone levels in attempt to detach the diagnostic procedure from convulsive episodes.
Materials and Methods
Participants
Our cohort consisted of 75 females of which 15 were patients diagnosed with PNES (9). Patients (M age=37.67, SD age=15.66) were recruited from video-EEG logs at Loma Linda University Medical Center (LLUMC). All were diagnosed with PNES using video-EEG monitoring by an epileptologist and psychiatric evaluation (Reference Alsaadi and Marquez3). The control group of sixty healthy females (M age=22.07, SD age=5.32) was randomly recruited from Scripps College and Claremont Graduate University (CGU) through flyers posted around the Claremont Colleges. Only women were tested because they are more likely to report significant physical and sexual abuse histories, and the incidence of PNES is threefold higher in women (Reference Devinsky, Gazzola and Lafrance2,Reference Alper, Devinsky, Perrine, Vazquez and Luciano15,Reference Oto, Conway, McGonigal, Russell and Duncan16) as reflected in our all-female index group. All participants enrolled in the study completed a shortened version of the Jacobs Neglect, Abandonment, and Abuse Protocol (J-NAAP) (Reference Jacobs17) administered by a clinician to determine the presence and severity of abuse/neglect. It assesses traumatic or stressful life events such as loss or abandonment, serious neglect, physical abuse, emotional abuse, and sexual abuse. Based on self-reported abuse scores, the 60 controls were further divided into two groups: healthy controls (HC, N=33, J-NAAP scores=0), and healthy controls that had experienced abuse (AC, N=27, J-NAAP scores>0). Additional hormonal and psychological descriptive statistics are reported in (9).
Exclusion criteria for both patients and healthy controls were clinically significant suicidal ideation and psychotic features; substance abuse disorder [per Diagnostic and Statistical Manual of Mental Disorders (4th edition) TR] within the past 6 months; any current or past psychiatric disorder that could interfere with diagnostic assessment or study adherence; treatment with psychoactive medications (other than mood stabilisers or Ambien); clinically unstable medical conditions; clinically verified mixed epileptic and non-epileptic seizures; treatment with an experimental drug or device within 60 days of study enrolment. None of the participants were on anti-epileptic medication at the time of the blood sampling. Only participants (PNES and controls) who did not show any depressive tendency, according to an abridged version of the Beck Depression Inventory (BDI) (Reference Beck, Ward, Mendelson, Mock and Erbaugh18), were included (i.e., BDI<20). The study was approved by the Institutional Review Boards of LLUMC, CGU, and Scripps College. All participants gave written informed consent before commencing participation.
Serological measurements
Serum NPY, ACTH, cortisol, oxytocin (OXT), testosterone, prolactin, progesterone, and estradiol were collected between 6 pm and 8 pm, to control for diurnal variation. Blood was drawn from an antecubital vein, using ethylenediaminetetraacetic acid whole-blood tubes and a serum-separator tube using Vacutainer® (Becton, Dickinson and Company, Franklin Lakes, NJ, USA) blood collection kits. After phlebotomy, each tube was immediately stored on ice. The tubes were then placed in a refrigerated centrifuge and spun at 1500 rpm at 4°C for 12 min. Serum was drawn from these tubes and placed into 2-ml polypropylene Fisherbrand screw cap with O-ring microtubes. The microtubes were immediately placed on dry ice and then transferred to a −70°C freezer until analysis. All tests were performed at the Endocrine Core Laboratory of the Yerkes National Primate Research Center at Emory University, Atlanta, Georgia, USA, using radioimmuno and enzyme-linked immunosorbent assays. Commercial kits from American Laboratory Products Company, Windham, NH (NPY), DiaSorin Inc, Stillwater, MN (ACTH), Diagnostic Systems Laboratories, Webster, TX (cortisol and PRL), Beckman Coulter, Webster, testosterone, Assay Designs Inc, Ann Arbor, MI (OXT), Siemens (Formerly Diagnostic Products Corp.), Los Angeles, CA (progesterone and estradiol), were used. All inter-assay and intra-assay coefficients of variation were within acceptable bounds (<15%).
Statistical analyses
The distribution of the hormone data was checked using QQ-plots and the Shapiro–Wilk test for normality. Since normality was violated (Shapiro–Wilk W range for all raw hormones=0.359–0.938, median=0.707), all hormone data were log transformed (W range for all log hormones=0.805–0.989, median=0.939).
The probability of a participant being a PNES patient or a healthy control was estimated using hormone measures as predictors in a binomial logistic prediction model. Predictors were included in the model using stepwise-forward regressor selection based on the lowest Akaike information criterion. Subjects with PNES were defined as positives, while subjects without PNES were defined as negatives. If the model estimated the probability of the subject to have PNES to be at least 50%, then we predicted that the subject had PNES, that is, to be a positive.
Sensitivity (i.e., the true positive rate), specificity (i.e., the true negative rate), and accuracy (ACC) were then calculated from all possible leave-one-out cross-validations (LOOCV) using traditional formulae: sensitivity=classified true positives (TP) divided by all real positives; specificity=classified true negatives (TN) divided by all real negatives; ACC=the sum of TP and TN divided by the whole sample. We estimated the model on the population of PNES and HC. As a measure of the goodness of the binomial logistic model in this setting, we calculated McFadden’s pseudo-R 2 for logistic regression. In addition, the area under the curve (AUC) of the receiver operating characteristic was also calculated as additional performance metric in cross-validation methods (Reference Forman and Scholz19).
Results
The stepwise-forward regressor selection extracted two independent variables, NPY and ACTH. The first predictor selected for inclusion was NPY, and the resulting predictive models yielded an ACC of 81.2% (specificity=87.9%; sensitivity=66.7%) and an AUC well above chance (AUC=0.871). The second additional predictor to be included was ACTH (and its interaction with NPY). This increased ACC to 90.5% (specificity=93.3%; sensitivity=88.9%) and the AUC to 0.980. This model was able to explain 75% of the variance (pseudo-R 2=0.747). When we included the third predictor, the model started to show signs of overfitting (both the pseudo-R 2 and the maximum likelihood were 1).
As age was significantly higher in PNES compared to both AC and HC (ts>3.61, ps<0.002), we rerun the stepwise-forward regressor selection including age as predictor. Beside age, NPY was the first predictor found with an ACC of 85.1% (specificity=90.6%; sensitivity=73.3%) and an AUC of 0.962, explaining 58% of the variance. The second predictor was ACTH (without interaction, which overfitted the model) with an ACC of 87.5% (specificity=80.0%; sensitivity=59.3%) and an AUC of 0.982 that explained 79% of the variance. The introduction of a third predictor overfitted the model. With age included, ACC dropped from 90.2% to 87.5%, sensitivity from 88.90% to 59.30%, and specificity from 93.30% to 80.00%. Thus, our final model for predicting PNES used only the predictors NPY, ACTH, and their interaction:
 $$\eqalignno{ & P\left( {{\rm subject}\,{\rm has}\,{\rm PNES}} \right){\equals}\cr & \quad {1 \over {1{\plus}{\rm exp}\left( {{\minus}\left( {\beta _{0} {\plus}\beta _{1} \cdot {\rm NPY}{\plus}\beta _{2} \cdot {\rm ACTH}{\plus}\beta _{3} \cdot {\rm NPY} \cdot {\rm ACTH}} \right)} \right)}} \cr & $$
where
 $\beta _{0} {\equals}{\minus}235.04$
,
$\beta _{0} {\equals}{\minus}235.04$
,
 $\beta _{1} {\equals}49.62$
,
$\beta _{1} {\equals}49.62$
,
 $\beta _{2} {\equals}89.61$
, and
$\beta _{2} {\equals}89.61$
, and
 $\beta _{3} {\equals}{\minus}19.24$
.
$\beta _{3} {\equals}{\minus}19.24$
.
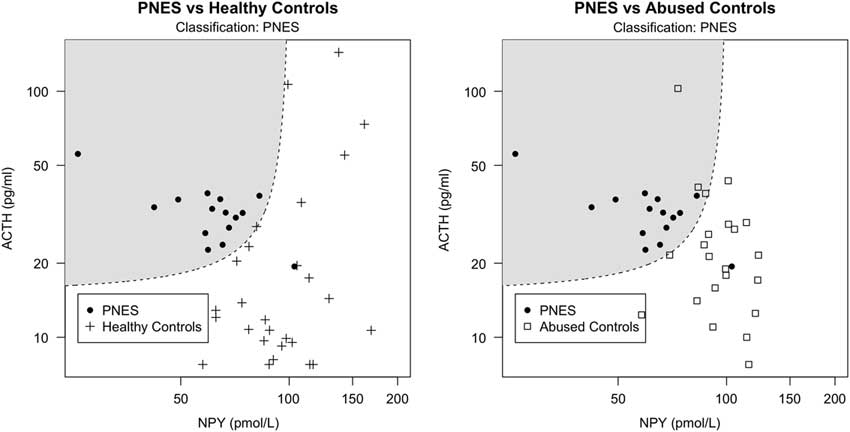
Since history of abuse is often present in PNES, and it was particularly severe in our PNES population, we tested this model on the AC group to exclude that our classification was due to abuse levels rather than PNES condition per se. If the model estimated on HC correctly classifies AC individuals as non-PNES patients, then we can infer that the same model is able to classify PNES regardless of abuse. Our model estimated on PNES and HC correctly classified 86.4% of the AC as non-PNES (ACC=83.8%, AUC=0.924), suggesting that classification was not due to the presence of abuse. In addition, to explore whether the same hormones would have been able to predict abuse instead of PNES, we ran the stepwise-forward regressor selection procedure on the group AC and HC with the aim of classifying abuse instead of PNES. The first regressor was ACTH, followed by NPY (interacting with ACTH) and OXT. These four regressors (ACTH, NPY, their interaction, and OXT) accounted for 19.6% of the variance with an ACC of 68.1% (AUC=0.797). Summary of results are presented in Table 1. Classification plots of PNES versus HC and PNES versus AC are displayed in Fig. 1.
Table 1 Stepwise-forward regressor selection for classifying PNES and abuse
AC, abused controls; ACC, accuracy; AIC, Akaike information criterion; AUC, area under the curve; HC, healthy controls; LOOCV, leave-one-out cross-validation; PNES, Psychogenic non-epileptic seizures; ROC, receiver operating characteristic.
In bold, our final model (
 ${\rm NPY}$
,
${\rm NPY}$
,
 ${\rm ACTH}$
,
${\rm ACTH}$
,
 $${\rm NPY} \cdot {\rm ACTH}$$
, see formula in text).
$${\rm NPY} \cdot {\rm ACTH}$$
, see formula in text).

Fig. 1 Classification scatter plot of non-log-transformed NPY against ACTH serum levels based on hormone measurements from PNES patients (represented by filled circles) and healthy controls (represented by crosses) in the left image, as well as PNES patients and controls with abuse (represented by squares) in the right image. The dashed line represents the 50% probability of being classified as either PNES or healthy (left) or abused (right) controls. The shadowed areas include the data points classified as PNES. Circles outside the shadowed area are false negatives, crosses and squares within the shadowed area are false positives.
Discussion and conclusion
In attempt to detach the diagnostic procedure from convulsive episodes, we successfully estimated a predictive model to distinguish PNES patients from healthy adults based on serum hormone levels. Our results confirm our previous findings (9), specifically that basal NPY is a predictive factor for PNES, while basal ACTH is moderately related to abuse. Whereas we only showed group differences in the original work, we are now, using the same study sample, able to apply our model (i.e., the interaction between NPY and ACTH) to the control group that had experienced abuse, and correctly classified 86.4% of these abused individuals as non-PNES cases. This means that although abuse is commonly present among patients with PNES, our model discriminates individuals with PNES from healthy individuals with or without a history of abuse. Further studies should be done with the aim to distinguish epilepsy from PNES patients.
Clinical features are generally more specific than sensitive (Reference Avbersek and Sisodiya20), but no single feature is definitively diagnostic of PNES (4). In video-EEG sensitivity is rarely above 50% and specificity is quite high, often between 80% and 90% (4). A diagnostic procedure for PNES detached from convulsive events might represent an important improvement in overall healthcare for these patients, especially considering its feasibility and affordability. In addition, PNES patients are often misdiagnosed as having epilepsy due to EEG misreading and therefore treated with expensive antiepileptic drugs that can have serious side-effects (Reference LaFrance, Baker, Duncan, Goldstein and Reuber7). The alternative that we have proposed uses basal hormone values independent of ictal episodes. This would permit patients and hospital resources to be liberated from the time consuming process necessary to test a convulsive event to diagnose PNES.
In the present work we use the LOOCV; a special case of cross-validation in which the predictive model is estimated using data from all but one sample and subsequently tested on the left-out sample. Besides being a very general method that can be used with any kind of predictive modelling, the LOOCV has several advantages when compared to other cross-validation procedures (e.g., k-fold validation), such as reduced bias and stable results due to the non-randomness of training/validation set splits (Reference James, Witten, Hastie and Tibshirani21). Furthermore, we calculated McFadden’s pseudo-R 2 for logistic regression as a measure of the goodness of the binomial logistic model in this setting, which tends to be much lower, and so more conservative, than the R 2 for multiple regression with values between 0.2 and 0.4 considered highly satisfactory (Reference Tabachnick and Fidell22). However, a possible confounding factor in our analyses could be represented by age, which was higher in the cases with PNES. Yet, although ACTH does not seem to vary with age (23), NPY seems to increase (Reference Baranowska, Radzikowska, Wasilewska-Dziubinska, Roguski and Polonowski24). Considering that our patients with PNES had lower levels of NPY (9), this, we suggest, might represent a strength of our results because our patients with PNES were significantly older than both controls. Baker et al. (25) found no statistically significant effect of circadian rhythmicity on either cerebrospinal fluid or plasma NPY levels, whereas Löckinger et al. (26) found some indications of small variation. Yet, in the present study, NPY blood draws, like those for ACTH known to present circadian rhythmicity, were all performed at the same time of day to minimise any time effects. This approach has also been used when comparing NPY levels in subjects with posttraumatic stress disorder to those in healthy controls (27,28).
Gender selection and sample size are certainly a limitation of the current study. In order to assess how well our results generalise or replicate, it is warranted to test these models against new sets of data, collected under different circumstances, with larger sample sizes, contrasting individuals with PNES to individuals with epilepsy with and without a history of abuse, including also men. In addition, further measures collection such as seizures frequency, age at onset seizures, and time from the last seizures are warranted. Next studies should also employ a repeated-measure design to track the evolution of specific-hormone endogenous production throughout the day (13).
If our results replicate, they would constitute a novel, cheap, and reliable approach that may allow rapid PNES diagnoses without relying on seizure occurrence.
Acknowledgement
Authors’ contributions: P.J.Z. and M.W. initiated the study. P.J.Z. and L.U.Z. recruited the subjects and performed the blood sampling. A.M. and A.S.P. performed statistical analyses and data interpretation, under the supervision of M.W. C.U.R. provided expertise on PNES patients and contributed to the data interpretation. A.M. wrote the first draft of the manuscript and all authors edited and approved it for publication.
Funding
This work was supported by a John Templeton Foundation grant to Paul J. Zak.
Ethical standards
The authors assert that all procedures contributing to this work comply with the ethical standards of the relevant national and institutional committees on human experimentation and with the Helsinki Declaration of 1975, as revised in 2008.