Significant outcomes
∙ Neurological softs signs (NSS) are highly significantly more frequent in schizophrenia patients compared with healthy controls.
∙ Medication, gender, age, age at onset, education, clinical subtype and paternal or maternal age do not influence neurological soft signs.
∙ NSS could be used as an auxiliary tool in the diagnosis of schizophrenia patients.
Limitations
∙ All the subjects have been previously hospitalised which may represent a more severe form of schizophrenia.
∙ Also, all patients were under antipsychotic and some also under benzodiazepine medications.
∙ Patients with comorbid somatic disorders were excluded which may decrease generalisability of results.
Introduction
NSS are a group of minor non-localisable neurological abnormalities. Mainly they include dysfunction in simple motor coordination, complex motor sequencing, and in integration, but also lateralisation variability (Reference Bombin, Arango and Buchanan1,Reference Heinrichs and Buchanan2). While they are not ‘psychomotor’ per se, it is important to note that psychomotor abnormalities are highly prevalent phenomena in schizophrenia and have to be considered as a heterogeneous construct, often including or misidentifying NSS (Reference Docx, Morrens and Bervoets3).
NSS are found more often in patients with schizophrenia in comparison with the normal population, even during the first episode (Reference Buchanan and Heinrichs4–Reference Zabala, Robles and Parellada10), while they are also present in relatives of patients and in general in individuals at risk to develop psychosis (Reference Barkus, Stirling, Hopkins and Lewis11–Reference Chan, Xie and Geng13). This means they could be of value as endophenotypes (Reference Chan and Gottesman14–Reference Chan, Xu, Heinrichs, Yu and Wang16). Medication of any type seem to have little or no impact at all (Reference Chen, Hui and Chan7,Reference Buchanan, Koeppl and Breier17–Reference Prikryl, Ceskova, Kasparek and Kucerova21). Whether they are specific to schizophrenia is a matter of debate (Reference Dazzan, Lloyd and Morgan20,Reference Goswami, Sharma and Khastigir22–Reference Zhao, Ma and Lui24).
The Neurological Evaluation Scale (NES) (Reference Buchanan and Heinrichs4) and the Cambridge Neurological Inventory (Reference Chen, Shapleske and Luque25) are the two most frequently used measures for NSS in schizophrenia and other neuropsychiatric disorders but a number of other instruments also exist (Reference Smith, Kadewari, Rosenberger and Bhattacharyya26–Reference Convit, Volavka, Czobor, De Asis and Evangelista30).
It should be noted that there are methodological issues resulting in inconsistencies in these studies comparing the prevalence of NSS in schizophrenia and other neuropsychiatric disorders. A major issue is that most of these studies have not controlled for confounding variables such as age, education and IQ. It has been shown that education (Reference Chen, Hui and Chan7,Reference Chen, Shapleske and Luque25) is inversely associated, whereas age is positively associated (Reference Chen, Hui and Chan7,Reference Chan, Xu, Heinrichs, Yu and Gong15) with NSS in patients with schizophrenia and healthy controls. Moreover, the different assessment tools used to measure NSS might have confounded the results in the literature.
Aim of the study
The aim of the current study was to establish neurological soft signs in patients with different clinical manifestations of schizophrenia and healthy controls, and test for the effect of gender, age, parental age, age at onset and clinical symptomatology on neurological soft signs in patients with schizophrenia in comparison with normal control subjects.
Material and methods
Study sample
The study sample included 133 patients suffering from schizophrenia according to DSM-IV-TR (77 males and 56 females; aged 33.55±11.22 years old) and 122 normal controls (66 males and 56 females; aged 32.89±9.91 years old) aged between 18 and 65 years.
A total of 35 (26.31%) of patients were not under medication while the rest were receiving medication with an average dosage in haloperidol equivalents of 6.25±6.05 mg/day (range 0–33). Some patients were also receiving benzodiazepines at the time of assessment due to the widespread use of benzodiazepines in general hospitals.
In terms of schizophrenia subtypes, 70 (52.63%) belonged to the paranoid subtype, five (3.75%) to the disorganized, none to the catatonic, 15 (11.27%) to the residual and 43 (32.33%) to the undifferentiated subtype.
In terms of education, patients with schizophrenia included 1 (0.75%) person who had no education at all, 25 (18.80%) with <6 years of education, 23 (17.29%) with 6–9 years, 51 (38.35%) with 9–12 years, 31 (23.31%) with a university degree, and 2 (1.50%) with post-graduate education. The corresponding numbers for controls were 0 (0.00%), 7 (5.74%), 12 (9.84%), 42 (34.43%), 55 (45.08%) and 6 (4.92%).
Patients were recruited from local hospitals and the diagnosis was made by two of the authors (K.N.F. and P.P.) with the use of the Mini-International Neuropsychiatric Interview (M.I.N.I.) and after consensus. The exclusion criteria for the present study included (1) a history of neurological disorder; (2) presence of any somatic disorder; (3) a lifetime prevalence of substance abuse; (4) IQ estimate lower than 70; and (5) age below 18 or above 65.
Controls came from the community, and their exclusion criteria included (1) presence of any mental disorder; (2) past history of any mental disorder; (3) family member with any mental disorder; and (4) age below 18 or above 65.
The study received ethical approval from the Ethics Committee of the School of Medicine, Aristotle University of Thessaloniki, Greece. Written informed consent was obtained from all participants before the administration of NES and related measures. The authors assert that all procedures contributing to this work comply with the ethical standards of the relevant national and institutional committees on human experimentation and with the Helsinki Declaration of 1975, as revised in 2008.
Assessment tools
The NSS were assessed with the use of the NES (Reference Buchanan and Heinrichs4) which includes four main subscales in addition to the total NES score: sensory integration, motor coordination, sequencing of complex motor acts and a fourth subscale with all other signs. Concerning the scoring of lateralising items, some researchers used the mean score while others kept the highest side score (Reference Malla, Norman, Aguilar and Cortese31–Reference Sanders, Keshavan and Forman34). We chose to use the sum of both (Reference Compton, Bercu, Bollini and Walker35). Two additional scores were used, the sum of all items concerning the left and the sum concerning the right side of the body.
The clinical symptoms of schizophrenia were assessed with the Positive and Negative Syndrome Scale (Reference Kay, Fiszbein and Opler36), depression with the use of the Calgary Depression Scale (Reference Addington, Addington and Schissel37,Reference Addington, Addington, Maticka-Tyndale and Joyce38) and the Montgomery-Asberg Depression Rating Scale (Reference Montgomery and Asberg39), anxiety with the State-Trait Anxiety Inventory form Y, State and Trait subscales (Reference Spielberger40–Reference Spielberger43), and manic symptoms with the Young Mania Rating Scale (Reference Young, Biggs, Ziegler and Meyer44). For the assessment of extrapyramidal signs which could affect the performance on the NES the following scales were used: The Simpson-Angus Rating Scale (Reference Simpson and Angus45), and the Extrapyramidal Symptom Rating Scale (Reference Chouinard and Margolese46). The Udvalg for Kliniske Undersøgelser (UKU) Side Effects Rating Scale (Reference Lingjaerde, Ahlfors, Bech, Dencker and Elgen47) was used for the assessment of adverse events. The General Assessment of Functioning scale was used for the assessment of general functioning and impairment (48) and the Annett Hand Preference Questionnaire (Reference Annett49) for the assessment of general functional lateralization (eye, hand, leg, etc.).
Statistical analysis
The statistical analysis included three steps. In the first step, exploratory t-tests were performed in order to determine the categorical variables to include in the second step. These exploratory analyses included gender separately in schizophrenic patients and healthy controls, any clinical subtype versus all the others together, and drug free versus medicated patients in terms of NES scores. Exploratory t-tests were performed with education transformed as a two-level variable (above vs. below 6 years of education) separately in schizophrenic patients and healthy controls, while analysis of variance was used to test for the effect of education (independent variable; six levels) on NES scale and subscales. Because of the great number of comparisons and in spite of the exploratory nature of this part of the analysis, the p<0.01 was chosen as the level of significance. If at least one significant effect concerning any of the NES scores was detected, then this specific grouping variable would be included with the grouping variables in the analysis of covariance (ANCOVA) which would follow.
The second step aimed at investigating for possible differences between the two diagnostic groups concerning the NES scores. It included ANCOVA with diagnosis and education (below and above 6 years) as grouping variables, age and maternal and paternal age as covariates and NES subscales as dependent variables. The Scheffe test was used as post hoc test.
The third step aimed to detect whether NES scores could be explained by the presence of other variables (e.g. clinical or side effects). It included simple linear regression analysis (SLRA) with forward stepwise method with NES subscales and total NES as dependent variables (seven separate regressions) and all clinical and extrapyramidal scales as independent variables. Finally, the Pearson correlation coefficient was used to explore correlations between NES subscales and clinicodemographic variables as an exploratory technique additionally to the SLRAs.
Results
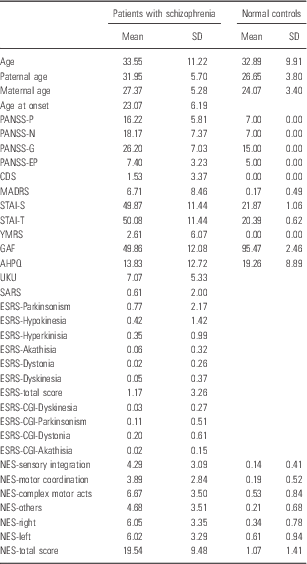
The descriptive statistics (means and standard deviations) for each variable in the two groups are shown in Table 1.
Table 1 Means, standard deviations of clinical and demographic variables in the two diagnostic groups

AHPQ, Annett Hand Preference Questionnaire; CDS, Calgary Depression Scale; ESRS, Extrapyramidal Symptom Rating Scale; GAF, General Assessment of Functioning; MADRS, Montgomery-Asberg Depression Rating Scale; NES, Neurological Evaluation Scale; PANSS, Positive and Negative Syndrome Scale; SARS, Simpson-Angus Rating Scale; STAI, State-Trait Anxiety Inventory; YMRS, Young Mania Rating Scale.
Exploratory t-tests revealed no significant differences between drug free and medicated patients, between genders in either the schizophrenic patients or healthy control group and between clinical subtypes in terms of NES subscales. There was a nominally significant difference for NES other signs between groups defined by education above versus below 6 years in the schizophrenic patients but not in the healthy control group; however, this did not survive correction for multiple testing (Table 2).
Table 2 Results of exploratory t-tests comparing subjects according to different groupings

Significant are those results with p<0.001 because of multiple corrections.
The ANOVA results revealed no significant differences between the six groups of subjects by diagnosis in terms of NES scores. Exploratory t-test with education as grouping variable (cut-off 6 years of education) detected only one significant comparison, for patients with schizophrenia concerning the NES-others subscale at the level of p<0.05. However, this would not survive correction for multiple comparisons.
The ANCOVA results suggested a significant effect for diagnosis but not for education or for their interaction. There was no significant effect of age or parental age (Table 3). Scheffe test suggested that all NES subscales differed between the two diagnostic groups (p<0.05).
Table 3 Investigating the effect of diagnosis and education on Neurological Evaluation Scale (NES) scores with parental age and age as covariates (analysis of covariance)

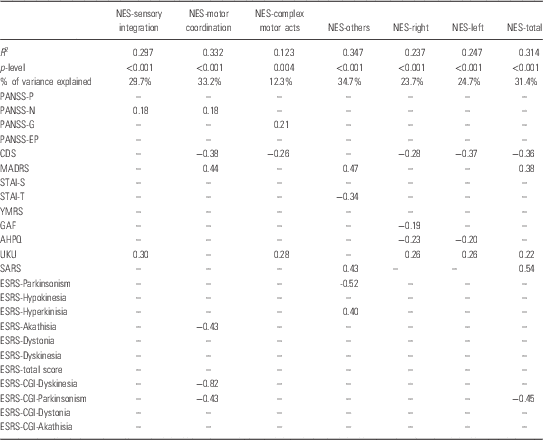
The results of SLRA returned significant results for all NES subscales. The models explained 12.3–33.2% of the variance of individual NES subscales (Table 4).
Table 4 Results of the simple linear regression analysis (SLRA) with each of the Neurological Evaluation Scale (NES) subscales as dependent and all the clinical variables as independent

AHPQ, Annett Hand Preference Questionnaire; CDS, Calgary Depression Scale; ESRS, Extrapyramidal Symptom Rating Scale; GAF, General Assessment of Functioning; MADRS, Montgomery-Asberg Depression Rating Scale; PANSS, Positive and Negative Syndrome Scale; SARS, Simpson-Angus Rating Scale; STAI, State-Trait Anxiety Inventory; YMRS, Young Mania Rating Scale.
The results include variables in each model, R 2, p-level and β coefficients.
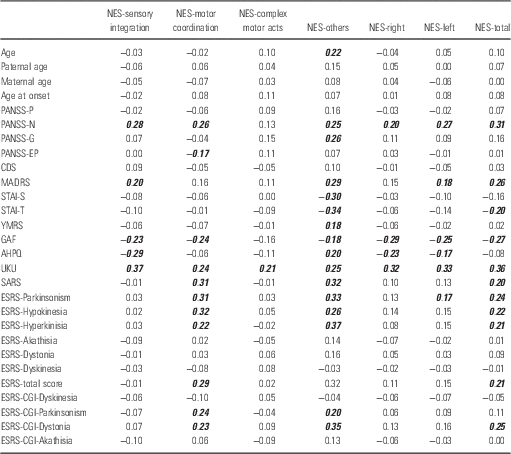
Correlations between NES subscales and clinicodemographic variables are shown in Table 5.
Table 5 Pearson correlation coefficients between clinical and demographic variables and Neurological Evaluation Scale (NES) subscales

AHPQ, Annett Hand Preference Questionnaire; CDS, Calgary Depression Scale; ESRS, Extrapyramidal Symptom Rating Scale; GAF, General Assessment of Functioning; MADRS, Montgomery-Asberg Depression Rating Scale; PANSS, Positive and Negative Syndrome Scale; SARS, Simpson-Angus Rating Scale; STAI, State-Trait Anxiety Inventory; YMRS, Young Mania Rating Scale.
The values in bold italics are significant at p<0.05 (patients with schizophrenia only).
Discussion
Summary of main findings
The results of the current study confirm that NSS are more frequent in patients with schizophrenia in comparison with normal controls. No control subject had a NES total score above 6 and only 11 (8.3%) of patients had scores below this level. The difference is so big that the NES could be used as an auxiliary diagnostic tool in the clinical assessment of schizophrenia. The results of this study do not support an effect of gender, age, age at onset, paternal or maternal age, education, medication status or clinical subtype of schizophrenia on NES scores. They also suggest that although there are some correlations between NES subscales and clinical features, especially with the negative symptoms of schizophrenia and depression as well as with extrapyramidal side effects of medications, these correlations are weak and most of NES variability is independent of these factors.
Relevance of the results of the current study to the existing literature, and implications for future research and clinical practice
Overall these results suggest that NSS constitute an independent (from the rest of symptoms), core (present in the vast majority of patients) and trait (unrelated to age and probably to the stage of schizophrenia) symptom of schizophrenia which could be of value in the clinical assessment and research of schizophrenia.
Although overall our present results are not in full accord with the literature, they could serve to fill in gaps and inconsistencies observed so far.
Past research suggests a rather complex and unstable correlation with age and a strong correlation with clinical status (Reference Chan, Xie and Geng13,Reference Bachmann, Degen, Geider and Schroder50,Reference Gureje51). Most studies support a correlation with negative symptoms and report that NSS are more frequent in patients with a ‘deficit syndrome’ (Reference Albayrak, Akyol, Beyazyuz, Baykal and Kuloglu52–Reference Ruiz-Veguilla, Cervilla and Barrigon58). Our findings suggest a weak correlation of negative symptoms with NES sensory integration and motor coordination but overall are negative for the effect of age and clinical variables and are in accord with some other studies which, however, constitute the minority (Reference Gureje51,Reference Nasrallah, Tippin, Mccalley-Whitters and Kuperman59). Other studies report no relationship with lower cognitive ability, while the rates in normal controls are low (Reference Dazzan, Lloyd and Morgan20,Reference Tripathi, Soni, Tyagi, Mehta and Gupta60). Some authors suggest NSS are suitable for the staging of schizophrenia (Reference Prikryl, Ceskova and Tronerova56,Reference White, Stirling and Hopkins61) which again is not in accord with the results of the current study.
As NES is unrelated to gender, symptomatology, age at onset, paternal or maternal age, education, medication status and clinical subtype of schizophrenia, with only weak and rather sporadic correlation with negative symptoms, depression and adverse effects of medication, it is reasonable to suggest that NSS include a core biological–neurological deficit which constitutes a trait marker probably present already at disease onset and it is of neurodevelopmental origin. There are a number of papers in the literature which agree with these conclusions (Reference Peralta, De Jalon, Campos, Basterra, Sanchez-Torres and Cuesta62,Reference Janssen, Diaz-Caneja and Reig8,Reference Gunasekaran, Venkatesh and Asokan63–Reference Thomann, Wustenberg, Santos, Bachmann, Essig and Schroder66).
Strengths and limitations of the present study
One of the advantages of the current study is that it is the first to report on the possible relationship of NSS with gender, parental age and medication status and one of the very few reporting on the role of education and age. It explored the data first with exploratory analysis and then with multivariate techniques which include correction for multiple testing.
The limitations of the current study include the fact that all patients have been previously hospitalised which means they represent maybe a more severe form of schizophrenic illness.
Acknowledgement
Xenia Gonda is recipient of the Janos Bolyai Research Fellowship of the Hungarian Academy of Sciences.
Authors’ Contribution: K.N.F., I.N., V.K. and X.G. conceived and designed the study. K.N.F. and P.P. participated in involving the subjects. P.P. and V.K. participated in clinical assessment and data acquisition and management. K.N.F. and X.G. participated in data analysis. K.N.F. and X.G. wrote the first draft of the paper. All authors participated in interpreting the data and developing further stages of the paper.
Financial Support
This research received no specific grant from any funding agency, commercial or not-for-profit sectors.
Conflicts of Interest
None.


