Significant outcomes
∙ We found no significant γ-aminobutyric acid (GABA) changes in prefrontal or occipital cortex (OCC) in relation to electroconvulsive therapy (ECT). Thus, our findings do not support prior studies arguing for GABA as a key factor in the treatment effect of ECT on major depression.
∙ We used an advanced shimming tool and a very short-TE magnetic resonance spectroscopy (MRS) sequence, which enabled metabolite quantification in prefrontal cortex (PFC).
∙ We found significant reductions in N-acetylaspartate (NAA) levels following ECT, which could indicate neuronal loss or a transient dysfunction in PFC.
Limitations
∙ We included both patients with unipolar depression and bipolar disorder even though there may be variances in the aetiology of these disorders.
∙ Our results may be affected by the fact that all patients received pharmacological treatment during the course of ECT.
∙ We did not include a sham-treatment group, which would have allowed us to correct for placebo effects.
Introduction
Major depression (MDD) is a heterogeneous psychiatric disorder, and its biological underpinnings are not fully clarified. The principal theory ties depression to disturbances in monoamine transmission (Reference Brambilla, Perez, Barale, Schettini and Soares1–Reference Pehrson and Sanchez3). However, accumulating evidence suggests that dysfunction in GABA activity contributes to the pathophysiological processes underlying depression (Reference Pehrson and Sanchez3–Reference Sanacora, Mason, Rothman, Hyder, Ciarcia, Ostroff, Berman and Krystal5). Studies of serum (Reference Esel, Kose and Hacimusalar6) and cerebrospinal fluid (CSF) (Reference Gold, Bowers, Roth and Sweeney7) have found reduced GABA levels in depressed patients. Serotonergic neurons project from the raphe nuclei to inhibitory GABA neurons thus increasing GABA activity. Consequently selective serotonin reuptake inhibitors (SSRI) increase GABA levels in both healthy subjects (Reference Bhagwagar, Wylezinska, Taylor, Jezzard, Matthews and Cowen8) and depressed patients (Reference Sanacora, Mason, Rothman and Krystal9). The most effective treatment of severe depression is still ECT despite years of drug development. ECT has a pronounced effect in 70–90% of treated patients (Reference Bolwig10). It induces a generalised seizure by passing electric currents through the brain of the anaesthetised patient. Studies suggest that the anticonvulsive and antidepressant actions of ECT may be related to a compensatory increase in GABAergic activity (Reference Esel, Kose and Hacimusalar6,Reference Sanacora, Mason, Rothman, Hyder, Ciarcia, Ostroff, Berman and Krystal11).
MRS has emerged as a powerful tool for non-invasive quantitative in vivo measurements of chemical compounds in the human brain including GABA (Reference Near, Ho, Sandberg, Kumaragamage and Blicher12,Reference Bertholdo, Watcharakorn and Castillo13).
Previous studies of GABA in depression have been somewhat inconsistent, presumably due to patient heterogeneity and differences in methodology (Reference Sanacora, Mason, Rothman, Hyder, Ciarcia, Ostroff, Berman and Krystal5,Reference Sanacora, Mason, Rothman and Krystal9,Reference Godlewska, Near and Cowen14,Reference Sanacora, Gueorguieva, Epperson, Wu, Appel, Rothman, Krystal and Mason15). However, several studies have found reduced GABA concentrations in OCC (Reference Sanacora, Mason, Rothman, Hyder, Ciarcia, Ostroff, Berman and Krystal5,Reference Bhagwagar, Wylezinska, Jezzard, Evans, Ashworth, Sule, Matthews and Cowen16), dorsomedial/dorsal anterolateral PFC (Reference Hasler, van der Veen, Tumonis, Meyers, Shen and Drevets17) and anterior cingulate cortex (Reference Bhagwagar, Wylezinska, Jezzard, Evans, Boorman and Matthews18,Reference Price, Shungu, Mao, Kang, Cheema, Coplan, Mathew and Shungu19). Furthermore, two small MRS studies have demonstrated increasing cortical GABA levels in the occipital lobe after administration of SSRI (Reference Sanacora, Mason, Rothman and Krystal9) and ECT (Reference Sanacora, Mason, Rothman, Hyder, Ciarcia, Ostroff, Berman and Krystal11) suggesting a normalisation of GABA levels following these treatments.
Spin-echo full-intensity acquired localized (SPECIAL) spectroscopy is a pulse sequence that combines a one-dimensional image selected in vivo spectroscopy (ISIS) scheme applied along one axis and a spin-echo generated along the other two axes for the localisation of the volume of interest (Reference Lei, Xin, Gruetter and Mlynarik20). This sequence enables a short echo time, which in turn allows for quantification of a number of metabolites simultaneously including GABA, glutathione (GSH), glutamate (Glu), glutamine (Gln), choline (Cho) and N-acetylaspartate (NAA).
The primary aim of this study was to compare prefrontal and occipital cortical GABA levels in patients with MDD versus healthy subjects. The secondary aim was to examine the effects of ECT treatment on cortical GABA levels in depressed patients. A tertiary aim was to assess changes in additional neurometabolites such as GSH, Glu, Gln and NAA following ECT treatment.
Materials
The local ethics committee approved the study in accordance with the Helsinki Declaration. All participants received both oral and written information and were invited to bring a chaperone. All information was given in quiet surroundings and participants had the opportunity to ask clarifying question about their participation in the project. All participants gave written consent before attending the study.
Subjects
All patients were recruited after they had been referred for ECT at the Department of Depression and Anxiety at Aarhus University Hospital, Risskov. All patients met the criteria for MDD or bipolar depressive episode according to ICD-10 and DSM-IV. Healthy subjects were recruited through advertisements.
Healthy subjects were matched for age and gender and screened for a history of mental or neurological disorders including epilepsy, neuropathic pain syndromes and movement disorders.
The exclusion criteria for patients were as follows: contraindications to magnetic resonance imaging, pregnancy, pronounced psychotic symptoms, risk of suicidal behaviour, delirium, alcohol and/or substance dependence, and severe medical and/or neurological disorders.
Patients were identified and recruited shortly after the decision to treat with ECT had been made, so that ECT treatment was not delayed due to study participation. Typically the MR scan was performed 1–2 days before ECT and again after the termination of the ECT series. Healthy subjects were only scanned once.
Methods
ET
ECT was performed with a Thymatron DG (Somatics LLC, Lake Bluff, IL, USA), following standardised guidelines regarding anaesthesia and ECT dose. Patients received ECT three times per week. The electrodes were placed ad modum d’Elia over the right hemisphere of both right-handed and left-handed patients. Stimulus intensity was determined as a function of age and readjusted from treatment to treatment to accomplish 20–25 s of electroencephalographic seizure activity. Thiomebumal and suxamethonium were used as anaesthetics. Treatment was terminated based on clinical judgement of the treating psychiatrist who was not directly involved in data acquisition and data analysis. All patients were treated with unilateral ECT except one who, due to insufficient convulsions, received one bilateral treatment.
Clinical information
Mood ratings were measured before and after ECT using Hamilton rating scale for depression (HAM-D). To the extent possible, the same trained psychiatrist, who was not directly involved in the process of data analysis, conducted the ratings. Treatment response was defined as a reduction in HAM-D score of 50% and remission was defined as a HAM-D score≤7 (Reference Cusin, Yang, Yeung and Fava21). Information concerning current and former depression states, co-morbidities as well as current drug use, was collected from medical records. As a part of standard procedures patients underwent physical examination and routine blood sampling before ECT.
Magnetic resonance imaging and spectroscopy
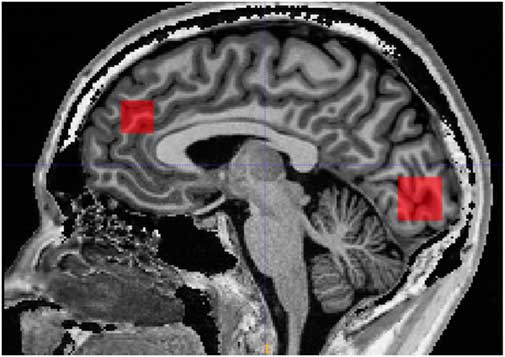
Scanning was performed on a 3 Tesla MR system (Siemens, Trio, Erlangen, Germany) with a body coil transmitter and a 32-channel receive head array. Data were acquired from a 30×15×15 mm voxel located in PFC and a 25×20×20 mm voxel located in OCC. A structural T1-weighted MPRAGE image (TR/TE 2420/4.58 ms, 1 mm isotropic resolution, scan time 10 min and 55 s) was acquired and used for manual positioning of the voxels and subsequent tissue segmentation. The PFC voxel was positioned just superior to genu of corpus callosum with the long axis along the right/left direction. The occipital voxel was oriented parallel to the occipital bone and just above the tentorium (Fig. 1).

Fig. 1 Illustration of prefrontal and occipital voxel placement.
Short-TE SPECIAL MRS data with water suppression were acquired (TR/TE=4000/8.5 ms, 256 averages for the PFC voxel and 128 averages for the OCC voxel). Spatial localisation was based on a combination of a 1D ISIS sequence in one direction and spin-echoes from slide-selected pulses in the other two directions. Outer volume suppression bands were placed on each side of the cubic voxel to suppress signals originating from outside the voxel. An advanced shimming sequence known as FASTESTMAP (Fast Automatic Shim Technique using Echo-planar Signal readout for Mapping Along Projections) (Reference Gruetter and Tkac22) was run before the acquisition of the SPECIAL MRS data in order to homogenise the magnetic field. The FASTESTMAP module was repeated multiple times, and shimming was regarded as acceptable when the calculated shim changes of each gradient (x, y, z) were less than 5 uT/m relative to the previous iteration. An unsuppressed water reference scan was acquired for water scaling and eddy-current correction (8 averages).
Magnetic resonance analysis
All spectra were processed in MATLAB Version R2013b using the FID-A processing toolkit (Reference Simpson, Devenyi, Jezzard, Hennessy and Near23) where subspectra were aligned, motion-corrupted averages were removed, frequency and phase drift-correction was performed and zero- and first-order phase corrections were applied. Processed SPECIAL data were then analysed using LCModel version 6.3-1H (Reference Provencher24), which models the data as a linear combination of 21 simulated basis spectra (alanine, asparate, phosphocholine, creatine, phospocreatine, gamme-aminobutric acid, Gln, Glu, GSH, glycine, myo-inositol, lactate, NAA, scyllo-inositol, taurine, beta-hydroxybutyrate, glucose, N-acetylaspartyl glutamate, glycero-phosphocholine, phosphoethanolamine, serine). The LCModel analysis was performed on spectra for chemical shifts in the range of 0.2–4.2 ppm. All metabolite concentrations were calculated in reference to total creatine (creatine+phosphocreatine). The GABA/Cr ratio was the primary outcome measure whereas other metabolites such as GSH/Cr, NAA/Cr, Glu/Cr, Cho/Cr and Gln/Cr were secondary outcomes. The quality of the spectra was assessed using spectral linewidth, signal-to-noise ratio and the standard error estimate for the model fit of each peak called the Cramér–Rao lower bounds (CRLB). Concentration estimates with CRLB>20% were removed from further analysis. Moreover, spectra with linewidths greater than 8 Hz or with Signal-to-noise ratio lower than 40 were discarded. Spectral linewidth was defined as the full width at half maximum and is a function of B0 field homogeneity over the measured volume of interest. The signal-to-noise ratio was defined as the maximum spectrum minus the baseline over the analyse window (i.e. between 0.2 and 4.2 ppm) divided by the standard deviation of residuals. The LCModel software reported all three measures.
To assess possible difference in tissue types within the voxel, the T1 MPRAGE images were segmented using the segmentation tool in the Statistical Parametric Mapping software (SPM8, http://www.fil.ion.ucl.ac.uk/spm/). For each voxel the fractions of grey matter (GM), white matter (WM) and CSF were calculated.
The researcher analysing the data was blinded to the time point at which the data were acquired (i.e. before or after ECT) and to whether the spectra were obtained from a patient or a healthy subject.
Statistics
Before the initiation of this study a power calculation for paired difference was performed based on data from a previous study by Sanacora et al. (Reference Sanacora, Mason, Rothman, Hyder, Ciarcia, Ostroff, Berman and Krystal11) showing an 85% increase in GABA levels after ECT (mean difference 0.66, t=−3.06). Assuming a similar effect size (0.66) and variation (SD of the change calculated from the t-score=0.62) of 10 patients would allow for a power >0.90 (Reference Kirkwood and Sterne25).
The GABA/Cr and other metabolite ratios in depressed patients were compared with those of the healthy subjects using an unpaired t-test. Effects of ECT were compared by paired t-tests. We tested for normality using Shapiro–Wilk test and histogram inspection and tested for homoscedasticity. If the assumptions of normality and homoscedasticity were not refuted, we calculated correlations using Pearson’s product-moment correlation (r). Cohen’s d was calculated for groups with different means. p-Values<0.05 were considered statistically significant. Data are given as mean±SD. Statistical analyses were performed using GraphPad Prism® (GraphPad Software, Version 6.0g, Trial) and Excel Version 14.1.0.
Results
Descriptive sample data
From December 2014 to June 2015, 11 patients (five men, six women) and 11 healthy subjects (five men, six women) were included. The mean age of depressed patients was 38.4 years (±10.9, range: 19–60 years) and mean age of healthy subjects was 38.8 years (±10.8, range: 19–59 years). Six patients met the criteria for MDD and five were diagnosed with a depressive episode of bipolar disorder (Table 1). According to the Hamilton depression rating scale (HAM-D17) five patients were moderately depressed (HAM-D17 score between 18 and 24), whereas six patients were severely depressed (HAM-D17 score above 24).
Table 1 Data of enrolled patients

ECT, electroconvulsive therapy; HAM-D, Hamilton rating scale for depression.
* Response to treatment. Defined as a 50% decline in Ham-D17.
† Remission. Defined as a Ham-D17≤7.
All patients improved on HAM-D17 following the ECT treatment (Table 1). Nine patients were categorised as responders and remission was achieved in five patients. Mean number of ECTs given was 12.5 (range 8–20) and mean time from last ECT to follow-up scan was 3.6 (±1.9) days.
All patients received pharmacological treatment during the study period. Patients were typically treated with antidepressants such as tricyclic antidepressants or serotonin and norepinephrine reuptake inhibitors. Patients with bipolar disorder were treated with lithium and/or antiepileptic drugs (treatment with antiepileptic drugs was suspended during ECT). All patients received an atypical antipsychotic drug and most patients received a short-acting hypnotic before bedtime. In the five patients treated with benzodiazepines with short half-life, this drug was given no less than 15 h before ECT.
GABA measurements in PFC
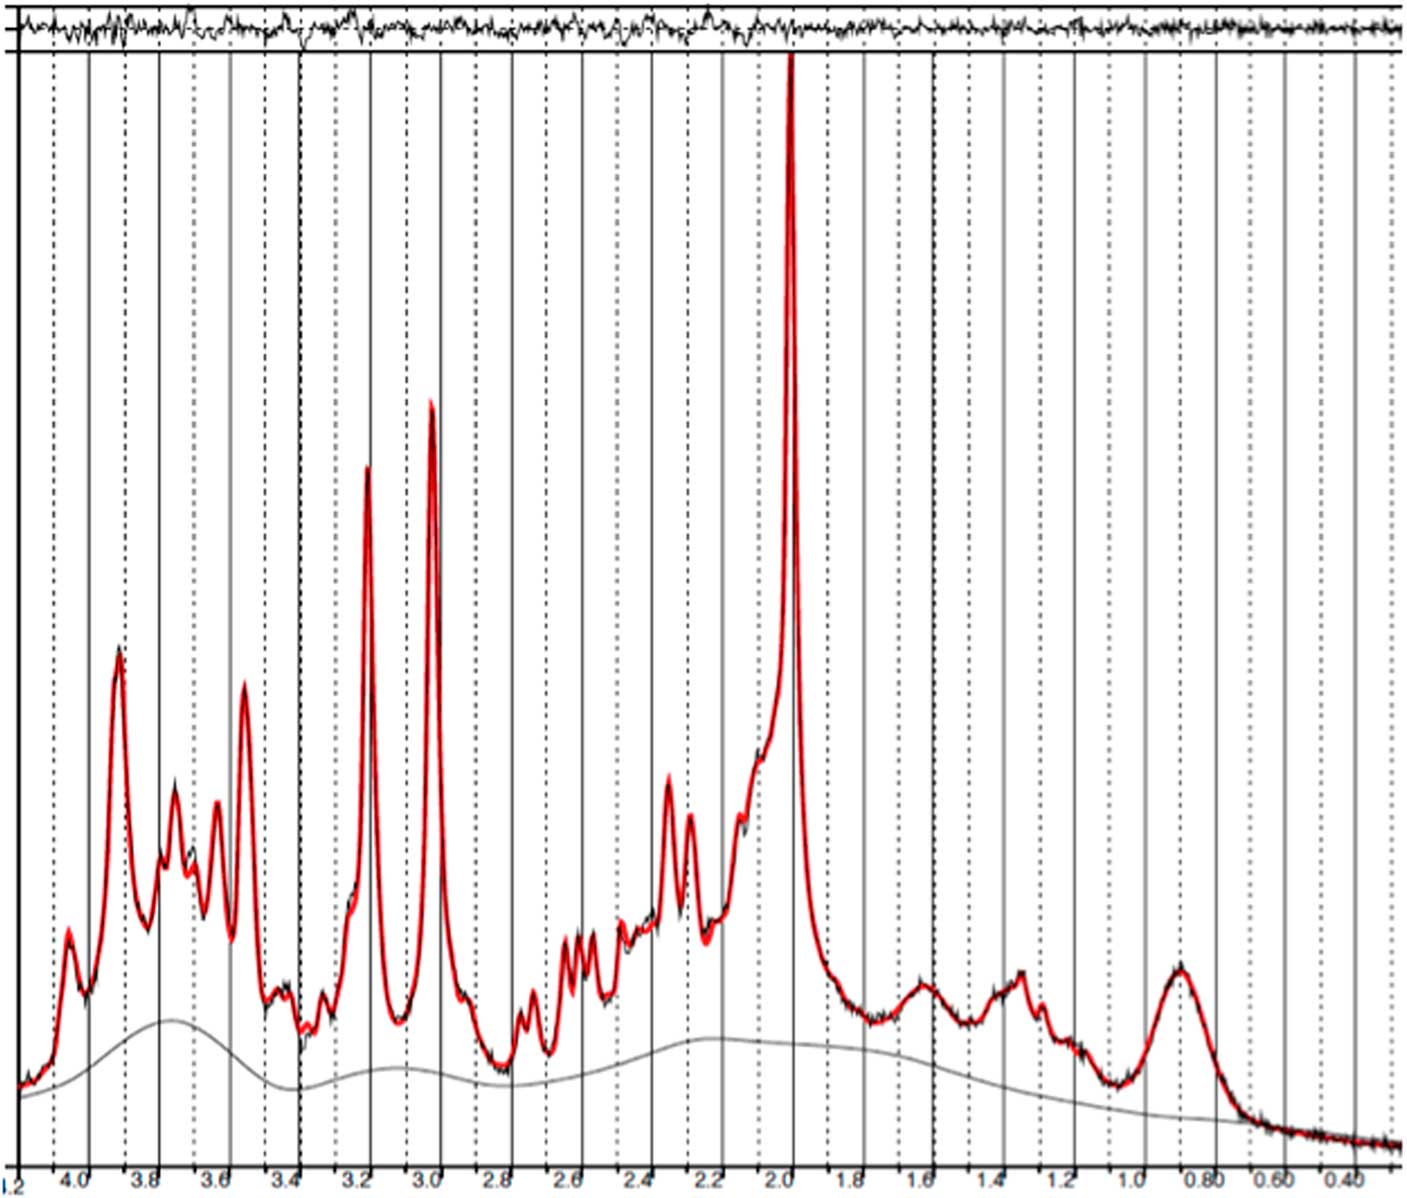
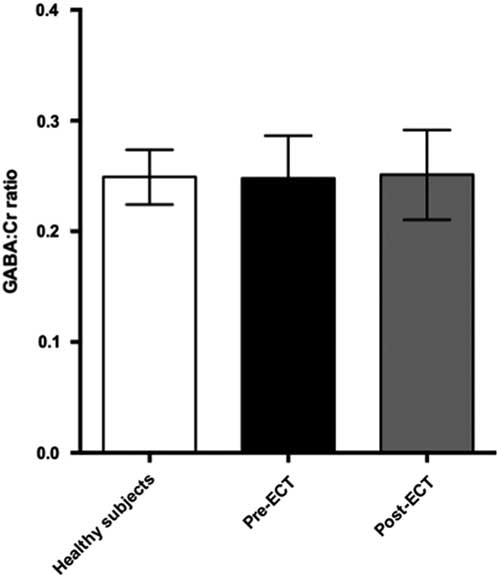
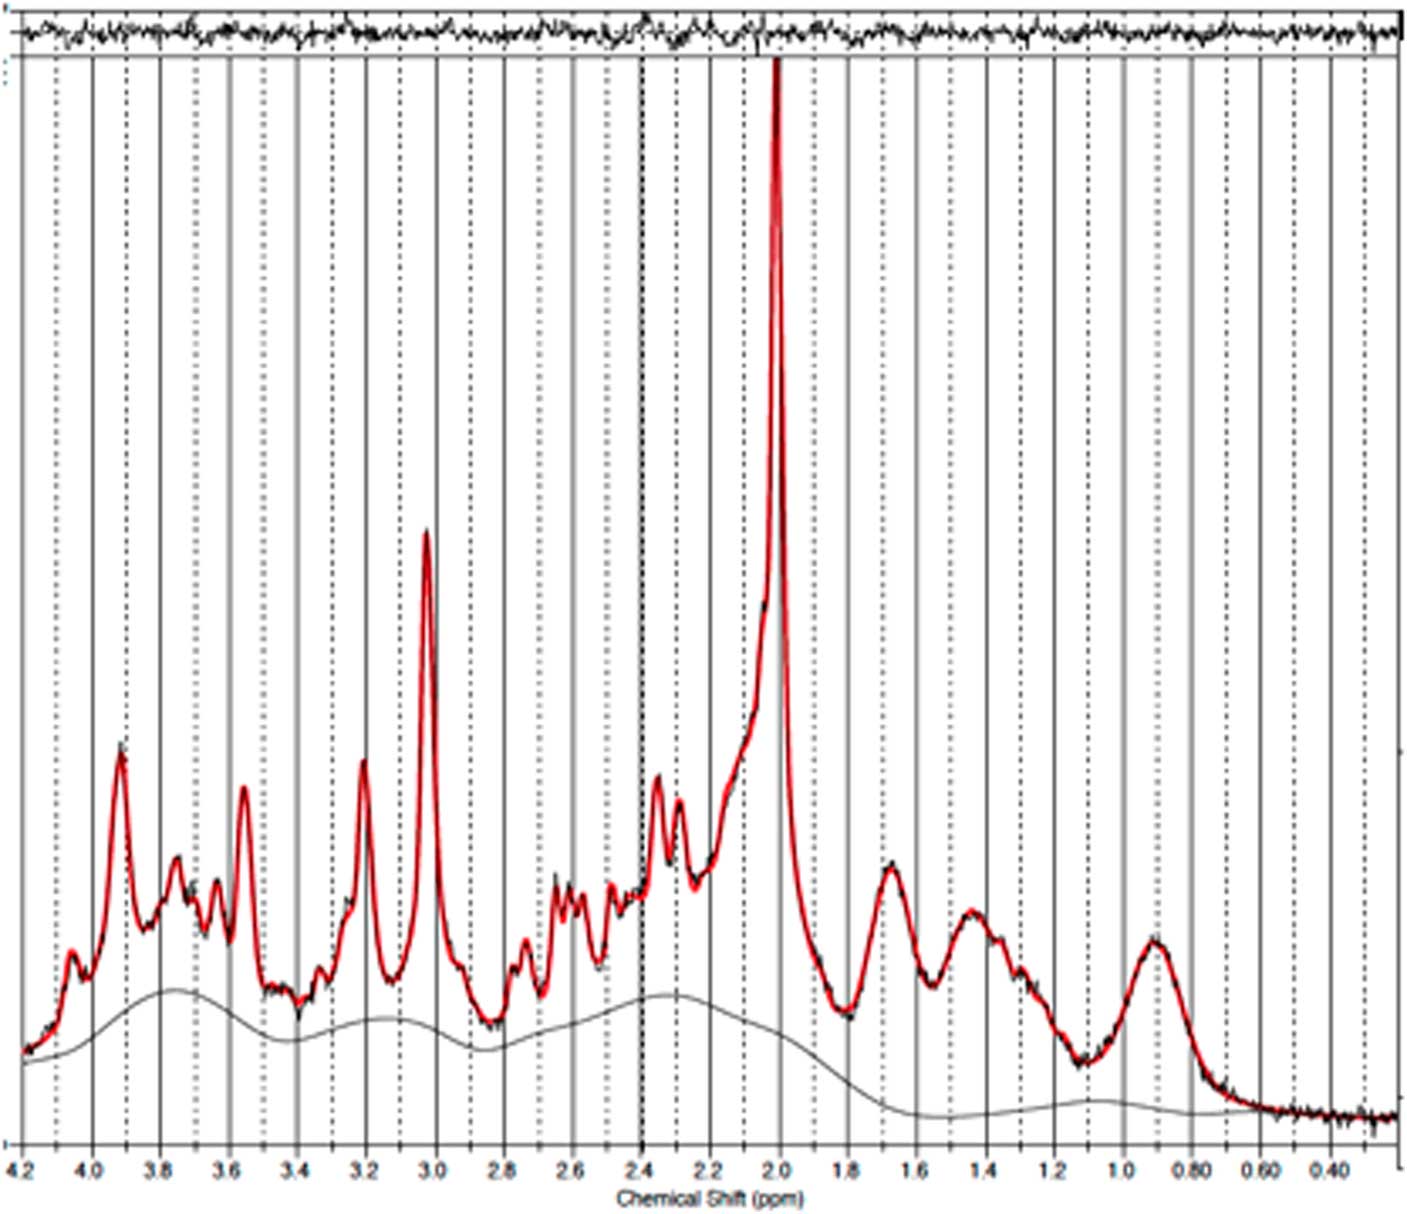
Baseline and follow-up data were collected from all 11 patients. However, prefrontal spectra from one patient (male) and one healthy subject (male) were discarded due to poor quality (CRLB>20%). Figure 2 illustrates representative spectra from PFC and Fig. 3 an individual plot for the GABA signal in PFC. No significant difference in prefrontal GABA levels was observed between patients pre-ECT (mean 0.248±0.04) and healthy subjects (mean 0.249±0.03), t(20)=0.089, p=0.93 (Fig. 4). To examine whether GABA/Cr ratios were affected by changes in creatine, we tested for significant differences in GABA/NAA ratios (p=0.92) and NAA/Cr ratios (p=0.99), but no significant difference was found. Diagnosis, that is bipolar disorder or MDD did not interact significantly with the GABA/Cr ratio (p=0.75). Moreover, we found no significant changes in GABA/Cr ratio after excluding patients receiving benzodiazepines.

Fig. 2 Example of a representative spectrum from the prefrontal cortex. The raw data are plotted as a thin black curve. The thick red curve is the LcModel fit to this data. The baseline is also plotted as a thin black curve. At the top are plotted the residuals.
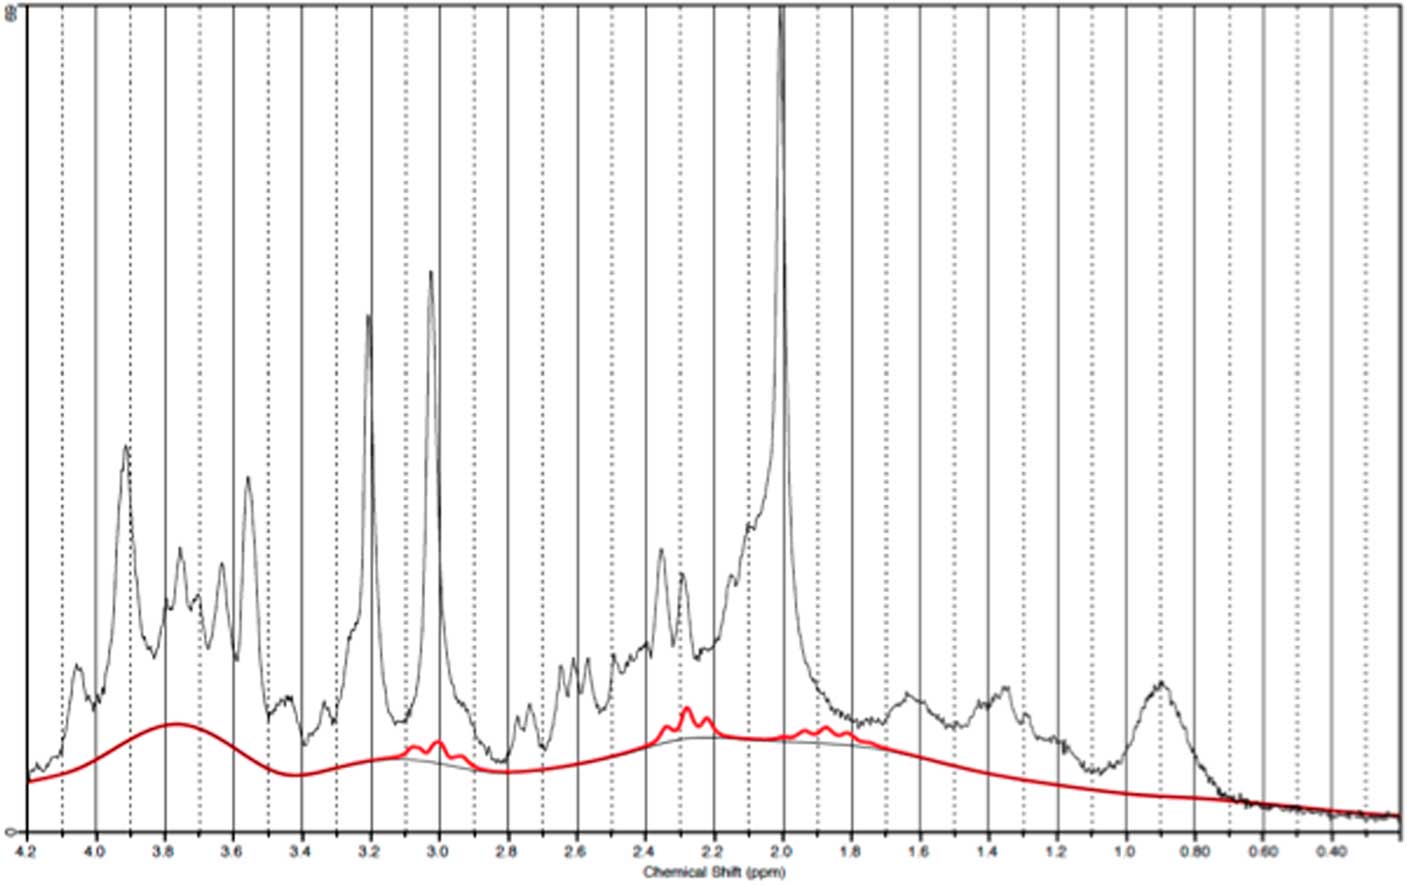
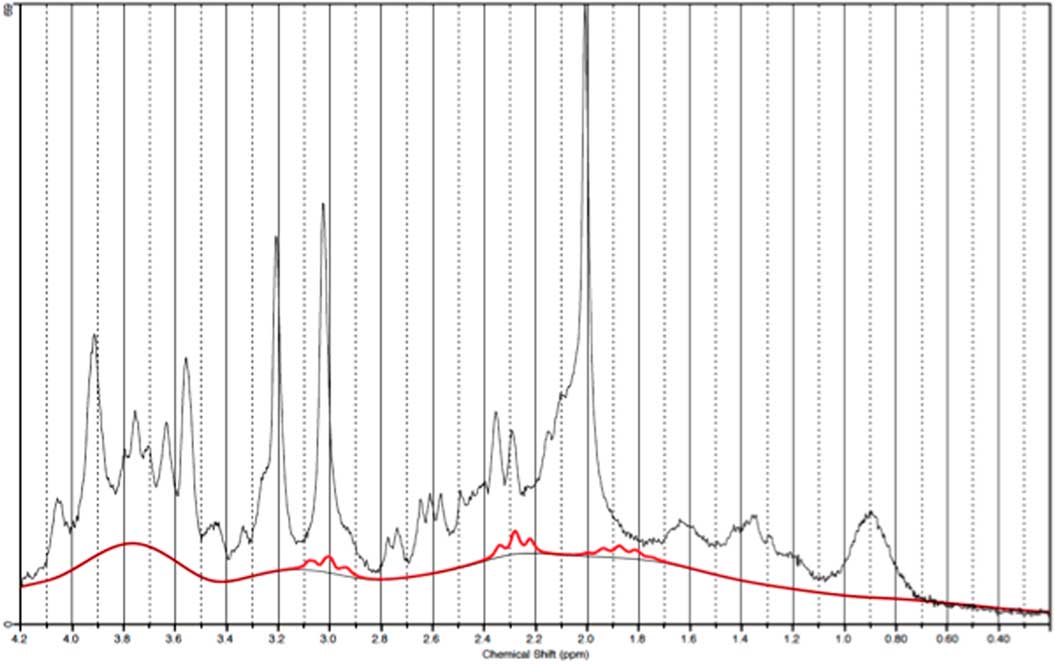
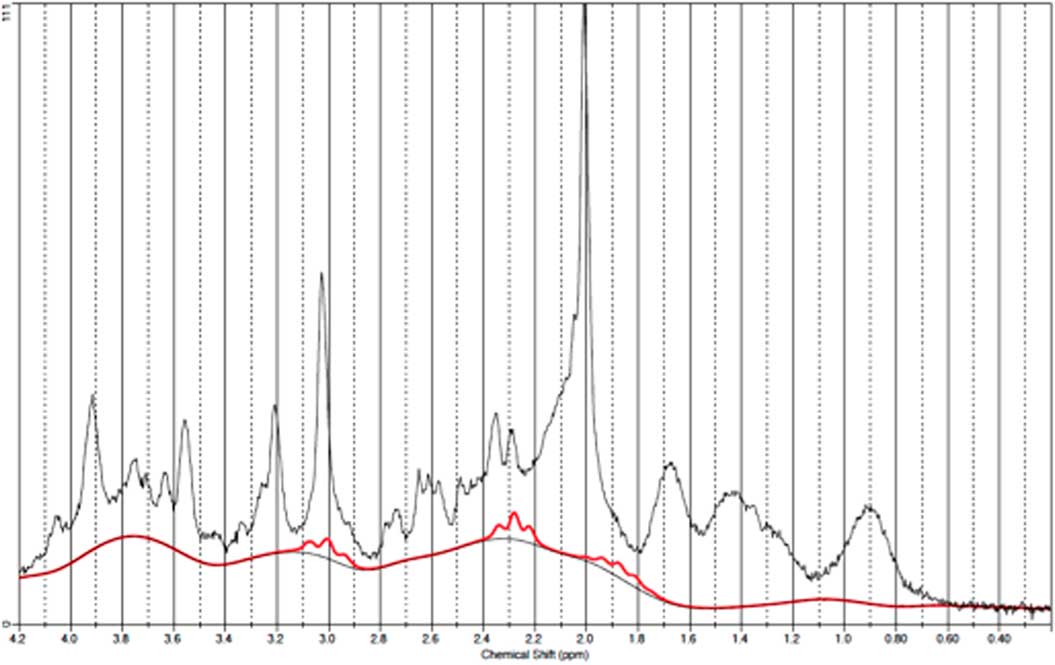
Fig. 3 Example of an individual plot for γ-aminobutyric acid from the prefrontal cortex. The raw data are plotted as a thin black curve. The thick red curve is the LcModel fit to this data.

Fig. 4 Plot of GABA:Cr ratios in prefrontal cortex showing mean ± SD. ECT, electroconvulsive therapy; GABA, γ-aminobutyric acid.
Comparing pre- and post-ECT GABA/Cr levels, we found no significant changes (t=0.10, p=0.92) as the mean GABA/Cr ratio was 0.249 (±0.04) pre-ECT, and 0.251 (±0.04) post-ECT. There was no correlation between changes in HAM-D17 rating scores and the fractional GABA/Cr changes [(GABApost−GABApre)/GABApre] (r(8)=0.43, p=0.21). Moreover, no significant correlation was found between pre- or post-ECT GABA/Cr levels and HAM-D17 ratings (p=0.77 and p=0.236, respectively).
Other metabolites of interest
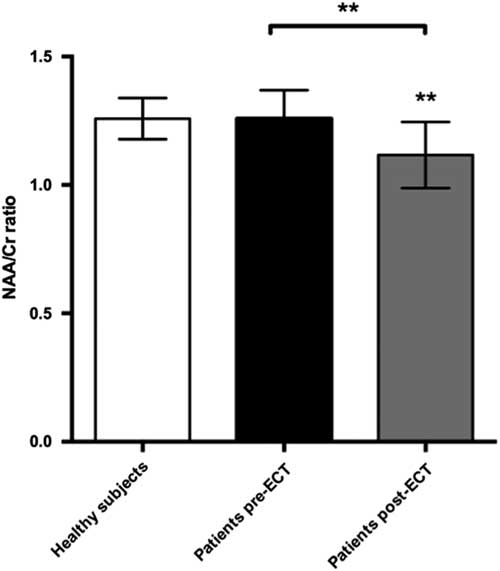
We found a significant decrease in the NAA/Cr ratios in the PFC during ECT, t(22)=3.89, p=0.0038. Cohen’s d was 1.18, representing a large effect size. This was still significant after a Bonferroni correction for the six tests made on prefrontal changes with ECT (giving a corrected p-value of 0.08). There was no significant difference when comparing baseline NAA/Cr levels between patients and healthy subjects. However, post-ECT NAA/Cr ratios were significantly lower in patients compared with healthy subjects, t(21)=2.9, p=0.007 (Fig. 5). Cohen’s d was 1.36. Finally, we found a significant correlation between numbers of ECT sessions and NAA/Cr change (p=0.035), with NAA/Cr ratios decreasing as the number of ECT sessions increased.

Fig. 5 Plot of NAA:Cr ratios in prefrontal cortex showing mean ± SD. ECT, electroconvulsive therapy; NAA, N-acetylaspartate.
To investigate whether the observed difference in NAA/Cr was caused by differences in GM content within the voxel we compared the fraction of GM from the segmented T1 image between healthy subjects (GM 0.56±0.05) and patients at baseline (GM 0.53±0.06), but found no significant difference (p=0.37). Also, post-ECT GM content (GM 0.55±0.06) did not differ significantly from baseline (p=0.35). Due to technical issues segmentation was only performed in nine patients and 11 healthy subjects.
No significant differences were found when comparing Glu/Cr, Gln/Cr, Cho/Cr, GSH/Cr or Glu/GABA ratios between patients and healthy subjects. ECT treatment did not significantly affect Glu/Cr, Gln/Cr, Cho/Cr or GSH/Cr levels (all p-values>0.05).
GABA measurements in OCC
Data from one occipital follow-up scan was discarded due to poor spectral quality. Figure 6 illustrates a representative spectra from OCC and Fig. 7 an individual plot for the GABA signal in OCC. When performing direct comparison between patients at baseline and healthy subjects, we found no significant difference in GABA/Cr ratios t(21)=0.37, p=0.72. The same applied when comparing pre- and post-ECT GABA/Cr levels in patients t (20)=0.78, p=0.47. Moreover, no significant correlation was found between pre-ECT GABA/Cr levels and HAM-D17 ratings (p=0404).

Fig. 6 Example of a representative spectrum from the occipital cortex. The raw data are plotted as a thin black curve. The thick red curve is the LcModel fit to this data. The baseline is also plotted as a thin black curve. At the top are plotted the residuals.

Fig. 7 Example of an individual plot for γ-aminobutyric acid from the occipital cortex. The raw data are plotted as a thin black curve. The thick red curve is the LcModel fit to this data.
Furthermore, no difference was found between NAA/Cr ratios in patients at baseline (mean 1.557±0.105) and healthy subjects (1.615±0.098, p=0.19) nor between patients before and after ECT (p=0.20). However, post-ECT NAA/Cr levels were significantly lower in patients compared with healthy subjects [t (21)=−2.29, p=0.03]. There was no correlation between NAA/Cr decline and number of treatments (p=0.94).
Finally, no significant differences were found when comparing Glu/Cr, Cho/Cr, Gln/Cr or GSH/Cr ratios between patients and healthy subjects and ECT treatment did not significantly affect Glu/Cr, Cho/Cr, Gln/Cr or GSH/Cr levels (all p-values>0.05).
Discussion
This study aimed to investigate whether changes in GABAergic activity play a role in the aetiology of depression and the antidepressive effect of ECT. However, no significant differences in GABA/Cr levels were found between depressed patients and healthy subjects, and ECT treatment did not alter the levels of GABA/Cr.
Findings in previous MRS studies of GABA levels in depression have been somewhat inconsistent. This discrepancy may be due to patient heterogeneity and differences in methodology. Early studies have found reduced cortical GABA levels in medication-free depressed patients (Reference Sanacora, Mason, Rothman, Hyder, Ciarcia, Ostroff, Berman and Krystal5,Reference Hasler, van der Veen, Tumonis, Meyers, Shen and Drevets17) as well as in patients fully recovered from depression (Reference Bhagwagar, Wylezinska, Jezzard, Evans, Ashworth, Sule, Matthews and Cowen16). However, other larger studies have reported normal GABA levels in depressed (Reference Godlewska, Near and Cowen14) and remitted patients (Reference Hasler, Neumeister and van der Veen26) in occipital and PFC, respectively. Prior studies have primarily investigated medication-free subjects, and not correlated GABA findings with treatment effects. However, Sanacora et al. found a significant increase in occipital GABA levels after ECT treatment in a group of eight depressed patients, suggesting a possible link to treatment effect (Reference Sanacora, Mason, Rothman, Hyder, Ciarcia, Ostroff, Berman and Krystal11). This is supported by studies finding an increase in occipital GABA levels with SSRI treatment (Reference Bhagwagar, Wylezinska, Taylor, Jezzard, Matthews and Cowen8,Reference Sanacora, Mason, Rothman and Krystal9), although no correlation has been found between GABA changes and treatment effect (Reference Sanacora, Mason, Rothman and Krystal9). In a study by Godlewska et al. (Reference Godlewska, Near and Cowen14) no significant difference was found in occipital GABA levels between depressed patients and healthy subjects. Furthermore, no changes in GABA levels were found after 6 weeks of SSRI treatment, arguing against GABA being a key neurotransmitter in depression. We found no difference in cortical GABA/Cr levels in medicated patients with depression and no changes in GABA/Cr levels after ECT. This could support the previous studies suggesting that low GABA levels could be a trait of vulnerability to mood disorder, rather than a neurochemical correlate of an abnormal mood state (Reference Bhagwagar, Wylezinska, Jezzard, Evans, Ashworth, Sule, Matthews and Cowen16) or argue that GABA is not involved in the pathogenesis of depression.
The mechanism of action of ECT is still not fully elucidated (Reference Bolwig10,Reference Nobler, Oquendo and Kegeles27). A compensatory increase in GABAergic activity has been suggested as a contributor to the antidepressant and anticonvulsant effects of ECT (Reference Brambilla, Perez, Barale, Schettini and Soares1,Reference Sanacora, Mason, Rothman, Hyder, Ciarcia, Ostroff, Berman and Krystal11). In animal studies, ECT acutely decreases GABA release or GABA synthesis, whereas repeated ECT increases GABA release, GABA concentration and GABAB-binding sites (Reference Brambilla, Perez, Barale, Schettini and Soares1). A previous MRS study of ECT treated depression found a large increase in GABA levels after ECT, but also a relatively large inter-subject variation and had no comparison to healthy subjects (Reference Sanacora, Mason, Rothman, Hyder, Ciarcia, Ostroff, Berman and Krystal11). We calculated a priori sample size estimations based on data from Sanacora et al. (Reference Sanacora, Mason, Rothman, Hyder, Ciarcia, Ostroff, Berman and Krystal11) but were unable to reproduce the prior large increase in GABA levels. Our study did not have enough power to detect small changes in GABA concentrations and therefore, we cannot rule out that the GABA concentrations change during ECT. However, it seems unlikely that the difference is as high as reported in the Sanacora study. Possible explanations for the inconsistency between the current and prior study could be differences between patients, MRS sequences used, and GM content in voxels among other things. Future studies are needed to clarify whether GABA levels change during ECT.
Despite being effective, ECT is still debated due to possible cognitive side effects such as transient anterograde and retrograde amnesia. Previous studies have used a wide range of imaging techniques to examine whether ECT has any adverse effects on brain tissue (Reference Bolwig10). The short-TE MRS method, used in the current study, allowed us to quantify a number of metabolites simultaneously including NAA. The function of NAA in the brain is still not fully clarified, but the NAA signal is regarded as a reliable marker of neuronal health and density (Reference Ende, Braus and Walter28). This is supported by findings of reduced NAA signals in neurological disorders associated with neuronal loss such as multiple sclerosis, tumours and stroke (Reference de Graaf29). We found lower NAA/Cr levels in patients after ECT and the decrease in NAA/Cr correlated with the number of ECT sessions, which argues against the decline being a coincidental finding.
In contrast to our results other MRS studies have reported an increase in NAA levels in responders to ECT (Reference Merkl, Schubert and Quante30,Reference Michael, Erfurth and Ohrmann31) suggesting a neurotrophic effect of the treatment. A previous MRS study by Ende et al. (Reference Ende, Braus and Walter28) investigated whether cognitive side effects of ECT correlate with neuronal loss resulting in permanent or reversible NAA decreases, but no changes in the hippocampal NAA signals were detected. Furthermore, a study by Jorgensen et al. (Reference Jorgensen, Magnusson and Hanson32) reported an increase in hippocampal and amygdala volume during ECT, but no significant changes in metabolite concentrations. However the study showed a decline in cortical NAA 1 week after ECT (p=0.031), considered insignificant due to multiple comparisons, which tended to normalise at the later 4 weeks follow-up scan. A recent MRS study by Njau et al. (Reference Njau, Joshi and Espinoza33) reported decreasing NAA in the dorsal ACC with ECT and argued that this could be caused by changes in the ratio of mature to immature neurons, thus supporting the neurotropic model of ECT. We posit whether a drop in prefrontal NAA could be associated to the often transient cognitive side effects of ECT. Unfortunately we had no systematic prospective registration of cognitive symptoms in our cohort. In the future it will be interesting to examine whether changes in NAA levels are correlated with ECT stimulus intensity, cognitive side effects and treatment effects.
All metabolite concentrations were calculated in reference to total creatine (creatine+phosphocreatine), because the LcModel absolute concentration outputs are given in arbitrary units. Using the Cr as internal reference we assume that the concentration of Cr in brain is relatively constant such that potential differences are explained by changes in the metabolite of interest and not due to changes in Cr. Njau et al. (Reference Njau, Joshi and Espinoza33) found that ECT was associated with a significant increase in Cr in the dorsal ACC. Thus, the NAA/Cr decrease in our study could be driven by a change in creatine. However, previous findings are conflicting since other studies report a decrease (Reference Merkl, Schubert and Quante30) or no change (Reference Michael, Erfurth and Ohrmann31) in Cr concentrations.
Strength and limitations
A major strength of our study is the use of an advanced shimming tool and a very short-TE MRS sequence, which enabled metabolite quantification in PFC. This is in contrast to a large number of studies, which due to inhomogenities in the magnetic field avoided measurements in the PFC. Despite using relatively strict criteria for spectra inclusion, compared with similar studies (Reference Merkl, Schubert and Quante30), we only excluded one prefrontal spectrum (<10%), demonstrating that the sequence is likely a good choice for future larger studies.
Several limitations to the present study have to be taken into account. Patients were diagnosed and treated based on a cluster of symptoms that may have different biological underpinnings. Furthermore, some patients were diagnosed with bipolar disorder making the final participant sample even more heterogeneous. Thus, variances in the aetiology of these subtypes of depression may have affected our results. Additionally, all patients received pharmacological treatment during the course of ECT. This is a major limitation in our study because most antidepressants affect GABA concentrations. Most patients received a prescription sleep-aid (typically zolpidem). Reports regarding the effects of zolpidem on in vivo neurochemistry are conflicting. MRS studies have shown that acute oral administration of benzodiazepines and benzodiazepine-like hypnotics reduce GABA levels in some brain regions (Reference Njau, Joshi and Espinoza33,Reference Fava, McCall, Krystal, Wessel, Rubens and Caron34). However, a recent MRS study demonstrated that zolpidem administration in depressed patients increases GABA levels in both ACC and thalamus. It is therefore still unclear how the administration of a benzodiazepine or benzodiazepine-like hypnotic affects the cortical GABA concentrations. Thus, we cannot rule out an effect of medications on the result parameters. However, excluding patients, who received benzodiazepines from the analysis did not change our findings significantly. Another limitation of our study is the small sample size, and thus the high risk of type II error. A post hoc effect size analysis showed, that with the very small increase in GABA/Cr in the current study (<1%), a total of 116 participants would be needed for a power of 0.8. Both the current and prior MRS study on GABA changes during ECT treatment have an inadequate number of participants enrolled. However, this reflects the challenge of including severely depressed patients undergoing ECT in a clinical trial. Finally, we did not include a sham-treatment group, which would have allowed us to correct for placebo effects.
Conclusion
Emerging evidence suggests that reductions in GABAergic activity contribute to the pathophysiological processes underlying depression. However, recent MRS studies are conflicting.
In the present study we did not find a difference in GABA/Cr levels in PFC between patients with MDD and healthy subjects. Furthermore, we did not find an effect of a course of ECT on GABA/Cr levels. This discrepancy in the findings of GABA levels in MDD may be due to patient heterogeneity and differences in methodology, but the current study does not support prior studies arguing for GABA as a key factor in the treatment effect of ECT on MDD. We did observe, however, a significant decrease in NAA/Cr levels following a course of ECT. Moreover, we found a correlation between number of ECT and NAA/Cr decline. This could indicate that ECT causes neuronal dysfunction or neuronal loss in PFC, but additional research is necessary to confirm these findings and investigate whether the NAA drop correlates with clinical findings.
Financial Support
All authors report no financial interests or potential conflicts of interest.
Acknowledgements
The authors would like to thank Siemens, Dr. Tim DeVito and Dr. Josef Pfeuffer for providing access to the FASTESTMAP shim sequences used. The study was supported by a grant from the Lundbeck Foundation (salary for M.K.K.).