


Significant outcomes
IL-6 levels at baseline can predict response to treatment with the adjunctive mitochondrial-enhancing agents.
There were no significant changes in levels of IL-6 and total antioxidant capacity after 16 weeks of treatment with N-acetylcysteine or the mitochondrial-enhancing agents.
There was no correlation between total antioxidant capacity and treatment response.
Limitations
The findings were limited by the modest sample size.
The inherent variability in sampling in a disease state with cycling states cannot be overlooked.
Other oxidative stress markers should be measured to evaluate whether oxidative stress moderates the effect of the combination therapy and if the therapy has any effect on oxidative stress pathways.
Introduction
Bipolar disorder (BD) is a complex mental illness characterised by periods of depression and manic or hypomanic episodes. Affecting 2–5% of the population, BD is one of the main causes of disability among young people, leading to cognitive and functional impairment and high rates of suicide (Anderson & Maes, Reference Anderson and Maes2015; Grande et al., Reference Grande, Berk, Birmaher and Vieta2018).
The pathophysiology of BD is still unclear and some studies suggest the involvement of pathways including mitochondrial dysfunction, alterations in circulating levels of pro-inflammatory cytokines, neurotrophins and oxidative stress (Bhat et al., Reference Bhat, Dar, Anees, Zargar, Masood, Sofi and Ganie2015).
Mitochondrial dysfunction in BD is thought to drive impaired brain energy metabolism. There is evidence of increased basal metabolic rate in mania (Caliyurt & Altiay, Reference Caliyurt and Altiay2009), and decreased bioenergetics in depression, concordant with a biphasic model of energy generation in BD (Boeck et al., Reference Boeck, Salinas-Manrique, Calzia, Radermacher, von Arnim, Dietrich, Kolassa and Karabatsiakis2018). Chronic inflammation is also a feature of BD in all phases of the illness as demonstrated by elevated circulating levels of Interleukin-6 (IL-6), tumour necrosis factor (TNF-α) and other pro-inflammatory cytokines (McNamara & Lotrich, Reference McNamara and Lotrich2012).
Both mitochondrial dysfunction and inflammation can contribute to oxidative stress. Lower antioxidant levels and increased production of reactive oxygen species (ROS) leads to oxidative stress, causing deleterious changes in macromolecules, such as lipids, proteins and DNA (Andreazza et al., Reference Andreazza, Kauer-Sant’Anna, Frey, Bond, Kapczinski, Young and Yatham2008; Pandya et al., Reference Pandya, Howell and Pillai2013). The central nervous system is particularly vulnerable to oxidative damage due to the high oxygen demands of this metabolically active tissue, in addition to physiological redox-generating brain processes (including auto-oxidation of neurotransmitters, redox-active metals and redox signalling) (Cobley et al., Reference Cobley, Fiorello and Bailey2018). Moreover, the central nervous system has limited antioxidant capacity, with superoxide dismutase and glutathione (GSH) as the main antioxidants in the brain (Pfaffenseller et al., Reference Pfaffenseller, Fries, Wollenhaupt-Aguiar, Colpo, Stertz, Panizzutti, Magalhães and Kapczinski2013). Mitochondrial dysfunction, oxidative stress and inflammation are related pathways and can operate synergistically in a positive-feedback cycle (Biswas, Reference Biswas2016).
Most ROS are produced by the mitochondrial respiratory chain. Mitochondrial dysfunction, which can be caused by increased inflammation and elevated production of ROS, can further increase production of ROS, leading to enhanced oxidative stress and dysregulation of signal transduction, synaptic plasticity and cellular resilience (de Sousa et al., Reference de Sousa, Zarate, Zanetti, Costa, Talib, Gattaz and Machado-Vieira2014).
Agents that target both oxidative stress and inflammation may be more effective in disease prevention or treatment. The antioxidant compound N-acetylcysteine (NAC) has demonstrated beneficial effects in the treatment of BD (Berk et al., Reference Berk, Copolov, Dean, Lu, Jeavons, Schapkaitz, Anderson-Hunt and Bush2008; Ellegaard et al., Reference Ellegaard, Licht, Nielsen, Dean, Berk, Poulsen, Mohebbi and Nielsen2019). NAC is a GSH precursor that acts by increasing the cysteine levels and has been shown to reduce depressive symptoms and improve quality of life in BD patients (Deepmala et al., Reference Deepmala, Slattery, Kumar, Delhey, Berk, Dean, Spielholz and Frye2015). NAC also has anti-inflammatory properties (Uraz et al., Reference Uraz, Tahan, Aytekin and Tahan2013) and has been shown to have positive effects on mitochondrial function (Wright et al., Reference Wright, Renoir, Smith, Frazier, Francis, Thorburn, McGee, Hannan and Gray2015).
Other agents such as coenzyme Q10 (ubiquinone), riboflavin (vitamin B2), thiamine (vitamin B1) and lipoic acid are known to enhance mitochondrial function through a variety of mechanisms such as increasing the activity of the electron transport chain, fatty acid oxidation and increasing pyruvate oxidation (El-Hattab et al., Reference El-Hattab, Zarante, Almannai and Scaglia2017; Kanabus et al., Reference Kanabus, Heales and Rahman2014).
To assess the efficacy of an intervention that targets both oxidative stress and inflammation (and potential mitochondrial dysfunction) in BD, a nutraceutical formulation was clinically trialled (see Supplementary Table 1). All of these agents are available for purchase without prescription in Australia.
Aims of the study
This study is a secondary analysis of a randomised clinical trial and aimed to evaluate changes in inflammatory and oxidative stress levels following treatment with NAC or mitochondrial-enhancing agents and the impact of these changes on clinical outcomes in participants with bipolar depression. In addition, we aimed to explore the potential role of these biomarkers as predictors and/or moderators of the clinical outcomes.
Methods
Participants
This study is a secondary analysis from a randomised controlled trial of adjunctive NAC or a CT (compared with placebo) in bipolar depression. The trial was registered on the Australian New Zealand Clinical Trials Registry (ACTRN12612000830897). The description of the study, including design, features and procedures has been published elsewhere (Dean et al., Reference Dean, Turner, Malhi, Ng, Cotton, Dodd, Sarris, Samuni, Tanious, Dowling, Waterdrinker, Smith and Berk2015). The study was a 16-week, multi-site, randomised, double-blind and parallel-group trial of NAC 2000 mg/day alone, NAC 2000 mg/day with CT or placebo. The main elements of the CT included acetyl L-carnitine (ALC), ubiquinone (Co Q10) and alpha lipoic acid (ALA), and co-factors known to be involved in mitochondrial function (see Supplementary Table 1 for details). The co-factor nutrient agents were chosen not only because of their individual benefits, but also due to their potential synergistic effects when administered adjunctively with other mitochondrially modifying nutraceutical agents. The rationale for the CT combination has been explained in detail in the published protocol (Dean et al., Reference Dean, Turner, Malhi, Ng, Cotton, Dodd, Sarris, Samuni, Tanious, Dowling, Waterdrinker, Smith and Berk2015). The clinical outcomes were a priori outcomes specified in the original randomised clinical trial proposal (Dean et al., Reference Dean, Turner, Malhi, Ng, Cotton, Dodd, Sarris, Samuni, Tanious, Dowling, Waterdrinker, Smith and Berk2015). The main trial paper has been published and includes all of the clinical outcomes (Berk et al., Reference Berk, Turner, Malhi, Ng, Cotton, Dodd, Samuni, Tanious, McAulay, Dowling, Sarris, Owen, Waterdrinker, Smith and Dean2019).
All participants met the DSM-IV-TR criteria for BD (I, II or NOS) and had a current acute depressive episode (Montgomery Åsberg Depression Rating Scale (MADRS) score ≥ 20). The participants received daily treatment in addition to treatment as usual for 16 weeks.
Only participants with valid biomarker data were included in this sub-study since the aim of this study was to evaluate the role of biomarkers, and as such valid biomarker data were an inclusion criteria.
Measurements
Demographic data were collected (age, gender, weight, height, psychiatric history, duration of illness and substance use). A structured clinical interview (MINI-Plus version) and validated outcome measures were performed including MADRS as the primary outcome. Secondary outcomes included Hamilton Anxiety Rating Scale (HAM-A), Bipolar Depression Rating Scale (BDRS), Young Mania Rating Scale (YMRS), Clinical Global Impression Improvement (CGI-I) and Severity (CGI-S) scales, Patient Global Improvement Scale (PGI), Social and Occupational Functioning Assessment Scale (SOFAS), Longitudinal Interval Follow-up Evaluation – Range of Impairment Functioning Tool (LIFE-RIFT) and Quality of Life Enjoyment and Satisfaction Questionnaire Short Form (Q-LES-Q-SF). Assessments were conducted at baseline, weeks 4, 8, 12, 16 and 20 (washout), and a phone interview at week 2. The time points for the investigation of biological parameters were baseline (week 0) and the end of the treatment phase (week 16).
Treatment adherence was monitored using capsule counts of returned clinical trial material. All adverse events were documented and monitored.
Blood analysis
Blood samples were collected at baseline and week 16 in serum separator tubes (Becton, Dickinson and Company, Franklin Lakes, NJ, USA). After the clotting period, tubes were centrifuged at 1006 x g and serum was aliquoted into cryovials and stored at −80°C until tested. IL-6 was determined using enzyme-linked immunosorbent assay (human HS Quantikine ELISA, R&D Systems, Minneapolis, MN, USA). Total antioxidant capacity (TAC) was measured using the OxiSelect™ Total Antioxidant Capacity Assay Kit (Cell Biolabs, San Diego, CA, USA). All assays were carried out following the manufacturer’s instructions. All samples were analysed in the same laboratory (Metabolic Research Unit, Deakin University) and the researcher was blinded to treatment during the experimental analysis.
Statistical analysis
Comparisons of serum levels of IL-6 and TAC at baseline (week 0) to end point (week 16) were performed using a paired t-test. Mean differences in biomarkers between groups were analysed using an independent samples t-test. To evaluate the role of the biomarkers as predictors of the outcomes, change scores were calculated as per cent change (absolute change divided by baseline value) for ease of comparison.
As described on the original trial publication, the outcomes were defined a priori. The primary outcome of interest was MADRS outcome, and SOFAS, LIFE-RIFT and CGI-I were secondary outcomes. Two separate models were implemented to evaluate the predictive role of each biomarker in the primary MADRS outcome. To evaluate the effect of potential predictors of outcomes and moderators, a constant baseline value as a moderator variable or time-varying covariate as a predictor of the outcome’ variable (one potential moderator or predictor at a time) was added to a generalised estimation equation (GEE) models. The GEEs had nominal intervention group allocation, log measurement of time as a continuous covariate and the two-way interaction between group allocation and (log of) time. An exchangeable covariance structure was used to account for within-participant auto-correlation. All three treatment groups were examined simultaneously in the same GEEs to avoid type I error inflation. The later GEE models included all two-way interactions and the three-way interactions between time, treatment group allocation and potential moderator or predictor. The three-way interaction evaluates the effect of the prediction of the outcome or moderator in a randomised controlled trial setting (Kraemer et al., Reference Kraemer, Wilson, Fairburn and Agras2002).
Whenever the three-way interactions were non-significant, two-way interactions between potential predictors or moderators and treatment group allocation were evaluated as a treatment-specific predictor of the outcome. Non-specific predictors of outcomes (main effect of potential predictor or moderator irrespective of treatment group allocation) were also investigated when the three-way and two-way interactions were not significant.
Since there was a significance trend for IL-6 at baseline, the impacts of IL-6 on all other biomarkers were additionally explored as a post hoc measure.
Responders were defined as the participants who had 50% or more reduction in MADRS scores from baseline to the end of the treatment (week 16) and to the end of the trial (week 20). Remitters were those who presented with MADRS scores of 7 or less at the end of the treatment and at the end of the trial. For responders’ and remitters’ analysis, logistic regression models were used to examine the effects of biological factors (IL-6 and TAC) on the NAC and CT treatment at baseline and the end of the trial by two-way interaction of the biomarker and treatment.
Any missing data in the follow-up time points were dealt with using GEE technique. Beta coefficient and 95% confidence intervals (CIs) were reported as effect size. For all analyses, two-tailed type I error of 0.05 was considered. No adjustment was performed for multiple comparisons for evaluating the role of biomarkers on the a priori MADRS outcome (i.e. two hypothesis tests were examined through testing the three-way interaction in each separate model; in total two tests). Statistical analyses were carried out using SPSS (IBM Corp. IBM SPSS Statistics for Windows, Version 25.0. Armonk, NY) and a significance level was set at 0.05.
Results
A total of 181 participants were included in the clinical trial analysis. Eighteen participants were not included in this sub-study as they did not provide blood samples. Thirty-three participants did not have post-randomisation data but had blood collected at baseline (which were included in the analysis). Therefore, in the final analyses, we have included 163 participants (53 in the NAC group, 56 in the CT group and 54 in the placebo group). At baseline, there was no significant difference on clinical measures and biological levels between the whole cohort and the cohort that completed the study (Supplementary Table 2).
The three treatment groups were similar on demographic, clinical and functioning measures at baseline (data published elsewhere) (Berk et al., Reference Berk, Turner, Malhi, Ng, Cotton, Dodd, Samuni, Tanious, McAulay, Dowling, Sarris, Owen, Waterdrinker, Smith and Dean2019). The descriptive comparisons of study outcomes per trial arm at baseline and week 16 are presented in Table 1.
Table 1. Descriptive comparisons of study outcomes per trial arm at baseline (week 0) and end point (week 16)

CT, combination nutraceutical treatment; MADRS, Montgomery-Åsberg Depression Rating Scale; BDRS, Bipolar Depression Rating Scale; HAMA, Hamilton Anxiety Rating Scale; YMRS, Young Mania Rating Scale; SOFAS, Social and Occupational Assessment Scale; LIFE-RIFT, Longitudinal Interval Follow-up Evaluation – The Range of Impaired Functioning Tool; CGI-S, Clinical Global Impressions – Severity Scale; Q-LES-Q, Quality of Life Enjoyment and Satisfaction Questionnaire; n, number of subjects per time point; SD, standard deviation.
Changes in biological parameters
There were no significant changes in the serum levels of IL-6 or TAC between baseline and week 16 within the treatment groups (Table 2). There were also no significant differences in the levels of IL-6 and TAC from baseline to the end of the study when comparing treatment groups versus placebo (Table 3).
Table 2. Comparisons of serum levels of IL-6 and TAC at baseline (week 0) to end point (week 16) using paired t-test

IL-6, Interleukin-6; TAC, total antioxidant capacity; UAE, uric acid equivalence; SD, standard deviation; n, number of subjects per time point; NAC, N-acetylcysteine; CT, combination nutraceutical treatment.
★Values transformed to logarithm due skewness.
Table 3. Between-group difference of biomarkers’ change from baseline using independent t-test

IL-6, Interleukin-6; TAC, total antioxidant capacity; UAE, uric acid equivalence; SD, standard deviation; n, number of subjects per time point; NAC, N-acetylcysteine; CT, combination nutraceutical treatment.
★Values transformed to logarithm due skewness.
The CT group has a strong tendency towards a lower IL-6 level at baseline compared with placebo (p = 0.078). The impact of IL-6 was explored in all models to take this potential confounder into account. A joint effect of IL-6 and TAC was only significant on SOFAS (χ2 = 4.79, p = 0.029, β = 14.23, 95%CI [1.49–26.98]).
Examining moderators
The results of the moderator analysis are described in Table 4 and Figure 1. Continuous moderators’ data were dichotomised as low and high based on baseline median for descriptive purposes. Otherwise, all continuous biomarker data were considered for modelling. Examining two-way interactions between biomarker change (change from baseline) and group allocation showed that lower baseline levels of serum IL-6 is a moderator of MADRS improvement in people treated with CT (χ2 = −4.91, p = 0.027, β = −4.42, 95%CI [−8.32 - −0.508]; Table 4).
Table 4. Examination of potential moderator effects of IL-6 and TAC on clinical response to adjunctive NAC and CT treatments
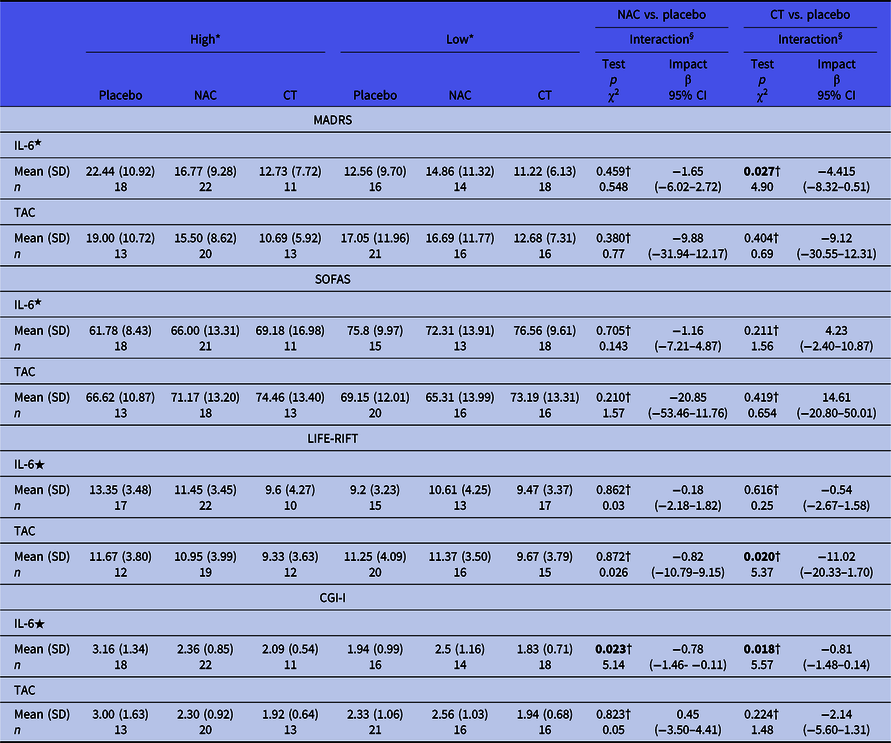
IL-6, Interleukin-6; TAC, total antioxidant capacity; NAC, N-acetylcysteine; CT, combination nutraceutical treatment; MADRS, Montgomery-Åsberg Depression Rating Scale; SOFAS, Social and Occupational Assessment Scale; LIFE-RIFT, Longitudinal Interval Follow-up Evaluation – The Range of Impaired Functioning Tool; CGI-I, Clinical Global Impression – Improvement; n, number of subjects per time point; SD, standard deviation.
Samples with inconclusive values for IL-6 and/or TAC were excluded from the analysis.
★Values transformed to logarithm due skewness.
* Continuous moderators’ data were dictomised as low and high based on baseline median for descriptive purpose. Otherwise for all continuous biomarker were considered for modelling.
† Two-way interaction between potential mediator and treatment group. Three-way interaction between potential mediator (baseline at levels of biomarkers), changes in clinical measurement and treatment group was not reported due to lack of statistical significance.

Fig. 1. Box plots for change of score (baseline to week 16) per treatment arms according to median split of the biomarkers.
In addition, lower baseline levels of IL-6 was a moderator of CGI-I improvement in both the NAC (χ2 = 5.14, p = 0.023, β = −0.78, 95%CI [−1.45 - −0.106]; Table 4) and CT groups (χ2 = 5.57, p = 0.018, β = −0.81, 95%CI [−1.48 - −0.137]; Table 4).
Lower baseline levels of TAC were a moderator of LIFE-RIFT improvement in the CT group (χ2 = 5.32, p = 0.021, β = −10.98, 95%CI [−20.31 - −1.654]; Table4). IL-6 was found to be a significant non-specific predictor of SOFAS outcome (χ2 = 4.32, p = 0.038). This finding indicates that baseline IL-6 levels predict improvement in function regardless of treatment group allocation.
To investigate whether the levels of circulating factors were predictors of remission or response status, logistic regression models were conducted using the levels of biological parameters at each time point as possible predictors. The only significant finding was between TAC levels at baseline and response to treatment (week 20; the non-treatment observation phase) in both the NAC (p = 0.031) and CT groups (p = 0.043). Since this was the only significant outcome from this analysis, we believe this is a spurious finding with no statistical relevance. No statistically significant findings were observed at week 16.
Discussion
The results of this study showed moderation of depressive symptoms and function in participants with BD after treatment with a CT designed to potentially improve mitochondrial function. Although our study showed no alteration in the inflammatory and/or antioxidant levels after supplementation with either NAC or CT, baseline peripheral IL-6 levels appear to be a predictor of clinical response, moderating the response to the CT. It is possible that IL-6 is directly interacting with the CT therapy to affect the clinical response, or that IL-6 levels are a secondary marker of the potential for response to CT.
IL-6 is an inflammatory cytokine expressed in immune cells, endothelial cells, myocytes, adipocytes, neurons, astrocytes and microglial cells (Erta et al., Reference Erta, Quintana and Hidalgo2012; Ji et al., Reference Ji, Chen, Gao, Jiao, Wang, Xu, Fu, Guo and Zhao2011). Elevated levels of peripheral IL-6 are reported in both manic and depressive phases of BD (Brietzke et al., Reference Brietzke, Scheinberg and Lafer2011, Reference Brietzke, Stertz, Fernandes, Kauer-Sant’Anna, Mascarenhas, Escosteguy Vargas, Chies and Kapczinski2009; Erta et al., Reference Erta, Quintana and Hidalgo2012; Luo et al., Reference Luo, He, Zhang, Huang and Fan2016; Munkholm et al., Reference Munkholm, Weikop, Kessing and Vinberg2015; O’Brien et al., Reference O’Brien, Scully, Scott and Dinan2006).
The CT therapy trialled in this study could be acting on inflammation in participants with BD and indirectly improving the symptomatology. Lowes et al. showed reduction in IL-6 levels by antioxidants that target mitochondria (Lowes et al., Reference Lowes, Webster, Murphy and Galley2013). This could explain the reduction (although not statistically significant) in IL-6 levels after 16 weeks of treatment. On the other hand, several studies have shown that IL-6 can exert a protective function in organs subjected to oxidative stress. Yang et al. showed that IL-6 can regulate mitochondrial activity. In an immune cell model from mice, they observed a cascade of signalling events triggered by IL-6, including the formation of mitochondrial respiratory chain super complexes required for adenosine triphosphate (ATP) production (Yang et al., Reference Yang, Lirussi, Thornton, Jelley-Gibbs, Diehl, Case, Madesh, Taatjes, Teuscher, Haynes and Rincón2015). In vitro studies showed that IL-6 protects cultured neuronal cells from apoptosis due to oxidative stress (Bissonnette et al., Reference Bissonnette, Klegeris, McGeer and McGeer2004; Maeda et al., Reference Maeda, Matsumoto, Hori, Kuwabara, Ogawa, Yan, Ohtsuki, Kinoshita, Kamada and Stern1994; Nakajima et al., Reference Nakajima, Yamada, Zou, Yan, Mizuno and Nabeshima2002) and a neuroprotective effect of IL-6 up-regulation in response to reactive oxygen intermediates (Wruck et al., Reference Wruck, Streetz, Pavic, Götz, Tohidnezhad, Brandenburg, Varoga, Eickelberg, Herdegen, Trautwein, Cha, Kan and Pufe2011). In our study, the participants with lower baseline levels of IL-6 may be ‘primed’ to respond to the CT therapy; they may have the necessary signalling capacity to make use of the co-factors and antioxidants in the adjunctive treatment.
However, it remains possible that the IL-6 levels are not directly related to the CT response, but are a secondary marker of dysregulation of other pathways. Relatively higher IL-6 levels at baseline may be indicative of a low-grade inflammatory state or may be a consequence of dysregulated mitochondrial function. Therefore, the elevated IL-6 may simply be a marker of those individuals who have an underlying disease process which is more amenable to intervention with this combination of antioxidant and mitochondrially active agents. The lack of change in IL-6 with treatment supports the possibility that this molecule is not directly induced (or suppressed) by the therapy.
Mitochondrial dysfunction is reported as a possible pathophysiological mechanism in BD, together with oxidative stress and inflammation (Kato, Reference Kato2017; Scaini et al., Reference Scaini, Rezin, Carvalho, Streck, Berk and Quevedo2016). The majority of the energy demands of the body are supplied by mitochondria via oxidative phosphorylation and ATP production (Lowes et al., Reference Lowes, Webster, Murphy and Galley2013). This can lead to high levels of ROS production and, consequently, ROS-induced damage under certain conditions (Lowes et al., Reference Lowes, Webster, Murphy and Galley2013). ROS can also be produced by activated inflammatory cells (Morris & Berk, Reference Morris and Berk2015). Besides ROS production, mitochondria are also targets of ROS-mediated damage (Lowes et al., Reference Lowes, Webster, Murphy and Galley2013).
There was no correlation between TAC and the treatment effect. Regardless, this does not exclude a potential oxidative stress role in the effect. Other markers could be measured to evaluate whether oxidative stress moderates the effect of the combination therapy and if the therapy has any effect on oxidative stress pathways.
Some limitations of this study should be acknowledged. The findings were limited by the modest sample size and loss to follow-up. The intention-to-treat principle requires that all randomised participants be included in the analysis; however, this study did not include 18 participants and it is impossible to determine if they are random samples from the total. The inherent variability in sampling in a disease with cycling states cannot be overlooked. It is possible that the variation between manic and depressive states obscures the relationship between IL-6 and treatment response, and contributes to ‘noise’ in the system. These secondary findings are exploratory in nature and the authors acknowledge the possibility of an inflated false discovery rate. The strong tendency towards lower IL-6 levels at baseline in the CT group is also a limitation. Although IL-6 level at baseline was included in the statistical models, no statistical method may completely account for such a circumstance. Future studies are required to further confirm these findings in BD and explore the mechanism(s) underlying the response to the CT in individuals with higher levels of IL-6. It is also important to note that this is a secondary analysis of the original clinical trial and the clinical findings might differ due to differences in sample size.
The identification of predictors of treatment response is crucial in psychiatry. Adjunctive NAC may be a potential candidate for the treatment of BD which could be more beneficial when administered in combination with other mitochondrial enhancing agents in BD patients that present with higher levels of IL-6.
Supplementary material
To view supplementary material for this article, please visit https://doi.org/10.1017/neu.2020.25
Acknowledgments
None.
Funding source
CCB is supported by an Alfred Deakin Postdoctoral Research Fellowship. MB is supported by a National Health & Medical Research Council (NHMRC) Senior Principal Research Fellowship (1059660). SMC is supported by a NHMRC Senior Research Fellowship (APP1136344). OMD is an R.D. Wright Biomedical Research Fellowship (APP1145634) and JS is supported by an NHMRC Clinical Research Fellowship (APP1125000).
Statement of interest
OMD has received grant support from the Brain and Behavior Foundation, Marion and EH Flack Trust, Simons Autism Foundation, Australian Rotary Health, Stanley Medical Research Institute, Deakin University, Brazilian Society Mobility Program, Lilly, NHMRC, Australasian Society for Bipolar and Depressive Disorders and Servier. She has also received in-kind support from BioMedica Nutraceuticals, NutritionCare and Bioceuticals. MB has received grant/research support from the NIH, Cooperative Research Centre, Simons Autism Foundation, Cancer Council of Victoria, Stanley Medical Research Foundation, MBF, NHMRC, Beyond Blue, Rotary Health, Geelong Medical Research Foundation, Bristol Myers Squibb, Eli Lilly, Glaxo SmithKline, Meat and Livestock Board, Organon, Novartis, Mayne Pharma, Servier and Woolworths; has been a speaker for Astra Zeneca, Bristol Myers Squibb, Eli Lilly, Glaxo SmithKline, Janssen Cilag, Lundbeck, Merck, Pfizer, Sanofi Synthelabo, Servier, Solvay and Wyeth; and served as a consultant to Astra Zeneca, Bioadvantex, Bristol Myers Squibb, Eli Lilly, Glaxo SmithKline, Janssen Cilag, Lundbeck Merck and Servier. JS has received either presentation honoraria, travel support, clinical trial grants, book royalties, or independent consultancy payments from Integria Healthcare & MediHerb, Pfizer, Scius Health, Key Pharmaceuticals, Taki Mai, FIT-BioCeuticals, Blackmores, Soho-Flordis, Healthworld, HealthEd, HealthMasters, Kantar Consulting, Grunbiotics, Research Reviews, Elsevier, Chaminade University, International Society for Affective Disorders, Complementary Medicines Australia, SPRIM, Terry White Chemists, ANS, Society for Medicinal Plant and Natural Product Research, Sanofi-Aventis, Omega-3 Centre, the National Health and Medical Research Council and CR Roper Fellowship. AT has received travel or grant support from the NHMRC, Deakin University, AMP Foundation, National Stroke Foundation, Hunter Medical Research Institute, Helen Macpherson Smith Trust, Schizophrenia Fellowship NSW, SMHR, ISAD and the University of Newcastle. SD has received grant support from the Stanley Medical Research Institute, NHMRC, Beyond Blue, ARHRF, Simons Foundation, Geelong Medical Research Foundation, Harry Windsor Foundation, Fondation FondaMental, Eli Lilly, Glaxo SmithKline, Organon, Mayne Pharma and Servier, speaker’s fees from Eli Lilly, advisory board fees from Eli Lilly and Novartis and conference travel support from Servier. CHN had served as a consultant for Lundbeck, Grunbiotics, Servier, Janssen-Cilag, Wyeth and Eli Lilly, received research grant support from Wyeth and Lundbeck, and speaker honoraria from Servier, Lundbeck, Bristol-Myers Squibb, Organon, Eli Lilly, GlaxoSmithKline, Janssen-Cilag, Astra-Zenaca, Wyeth and Pfizer.
Ethical standards
The authors assert that all procedures contributing to this work comply with the ethical standards of the relevant national and institutional committees on human experimentation and with the Helsinki Declaration of 1975, as revised in 2008.


