Significant outcomes
∙ The somatostatin (SST) system in mice is modulated in a multifaceted pattern following single and repeated electroconvulsive stimulation (ECS).
∙ ECS induces differential changes in SST and synthesis of SST receptors (SSTR1–4) gene expression as well as SST immunoreactivity and binding in the hippocampus and cortex.
∙ These alterations could contribute to modulating neuronal excitability and might be associated to the therapeutic effects of electroconvulsive therapy (ECT).
Limitations
∙ As repeated sham treatment may have a delayed effect on SST and SSTR mRNA expression, the observed changes in SST and SSTR1 expression 1 week following repeated ECS should be considered with this limitation.
∙ It remains to be determined to what extent the observed changes in the SST system are essential to the therapeutic effects of ECT.
Introduction
Although ECT is regularly used to treat patients with severe major depression, its mode of action still remains unclear (Reference Weiner and Krystal1). ECT has been found to regulate several neuropeptide systems, but the implications of these alterations have not been fully elucidated (Reference Mathé2–Reference Nikisch and Mathé4). The anticonvulsive effect of electroconvulsive seizures (Reference Mikkelsen and Woldbye5) has been suggested as one potential mechanism of action for ECT (Reference Sackeim, Decina, Prohovnik, Malitz and Resor6–Reference Sackeim8). Using ECS, an animal model of ECT, it has been shown that this treatment regulates several neuropeptide systems in the brain with anticonvulsant effect, including neuropeptide Y, galanin, and thyrotropin releasing hormone (Reference Mikkelsen and Woldbye5,Reference Bolwig, Woldbye and Mikkelsen9–Reference Veronesi, Aldouby, Domb and Kubek14). Thus the therapeutic effects of ECS might, at least in part, be due to adaptive modulation of neuropeptide systems with anticonvulsant effects (Reference Sackeim8).
SST is a widely distributed neuropeptide in the central nervous system that has also been shown to be regulated by repeated ECS as well as to display anticonvulsive properties (Reference Mikkelsen and Woldbye5,Reference Binaschi, Bregola and Simonato15–Reference Vezzani and Hoyer19). In patients diagnosed with major depression, decreased levels of SST immunoreactivity are found in the cerebrospinal fluid (CSF) whereas ECT elevates the concentration of SST (Reference Bissette, Widerlöv and Walléus20–Reference Vecsei and Widerlöv25). Consistent with these human findings, rat studies show that SST immunoreactive (-ir) neurons are activated by ECS (Reference Woldbye, Greisen, Bolwig, Larsen and Mikkelsen26) and that repeated ECS causes increases in SST mRNA expression and immunoreactivity in the hippocampal formation (Reference Mikkelsen and Woldbye5,Reference Dalby, Tønder, Woldbye, West, Finsen and Bolwig27–Reference Zachrisson, Mathé, Stenfors and Lindefors31). Further, previous studies using tests for depression-like behaviour show antidepressant-like effects of SST infusion in rats (Reference Engin, Stellbrink, Treit and Dickson32) as well as decreased immobility by disinhibition of SST interneurons in mice (Reference Funch, Jefferson, Hopper, Yee, Maguire and Luscher33). SST acts via Gi/o-protein coupled receptors (SSTR1–5), leading to a reduction in cAMP levels (Reference Ristori, Cammalleri and Martini34). While SSTR5 is virtually absent in the brain, SSTR1–4 are located throughout the brain, including the hippocampal formation and piriform cortex (Reference Cammalleri, Cervia and Langenegger35–Reference Hannon, Petrucci, Fehlmann, Viollet, Epelbaum and Hoyer37), which are brain areas known to play central roles in seizure regulation and depression (Reference Gale38,Reference Löscher and Ebert39). Several studies have examined the receptors responsible for the anticonvulsive effects of SST, and SSTR4 is believed to be the major receptor mediating the inhibitory effects on hippocampal excitatory neurotransmission while SSTR1, STTR2, and SSTR3 have a significant but secondary role (Reference Aourz, DE Bundel and Stragier40–Reference Qiu, Zeyda, Johnson, Hochgeschwender, De Lecea and Tallent43). In depressive-like behaviours, SSTR2 and SSTR3 in rats (Reference Engin and Treit44), and SSTR4 in mice (Reference Scheich, Gaszner and Kormos45) have been implicated in antidepressant-like effects.
Aims of the study
No previous studies have examined the effects of ECS on SSTR subtype expression or SST binding. Likewise, no studies have explored effects of ECS on SST synthesis in mice. Thus to further characterise effects of repeated ECS on the SST system, we studied the effects of single and repeated ECS on SSTR1–4 and SST expression, number of hilar SST-ir cells, as well as SST binding in hippocampal and cortical regions in mice.
Materials and methods
Animals
Adult Naval Medical Research Institute male mice weighing 30–40 g (Taconic M&B, Borup, Denmark) were used. The animals were kept in groups of eight per cage with a 12-h light/dark cycle and access to food and water ad libitum. Before being used in the experiment, the mice were handled daily during 7 days of acclimatisation to allow adaption to stressful events. The experiments were conducted in accordance with guidelines from the Danish Animal Experimentation Inspectorate and the European Communities Council Directive of 24 November 1986 (86/609/EEC).
ECS-induced seizures
ECS or sham was delivered for 14 continuous days (11 a.m. to 1 p.m.) as previously described (Reference Christiansen and Woldbye10). The stimulations were administered transcranially via a metal forceps applied to the skull immediately in front of the ears using a PSCC-10 pulse-stimulator (DCM Electronics, Copenhagen, Denmark), which delivers unidirectional square-wave pulses at a constant current (15 mA, 0.5 s, 50 Hz, pulse width=10 ms). ECS induced tonic-clonic seizure activity lasting 20–30 s in all mice. The animals were divided into four groups (n=10 per group): one group received sham-ECS once daily for 14 days (Sham), a second group was treated with sham once daily for 13 days followed by ECS on day 14 (single ECS), a third group was treated with ECS once daily for 14 days (repeated ECS) while a fourth group received ECS once daily for 14 days followed by 1 week without treatment (repeated ECS+1 week). Mice from the first three groups were decapitated 24 h after the last treatment, the fourth group 7 days after the last ECS. Immediately after, their brains were removed and frozen in −40°C isopentane, and kept at −80°C until sectioning.
Sectioning of brains
Brains were mounted on a cryostat (Shandon Inc, Pittsburgh, PA, USA) using cryo-embed (Ax-lab A/S, Vedbaek, Denmark) and sliced in 15 μm coronal serial sections throughout the dorsal hippocampus (Bregma; AP −1.34 mm to −2.54 mm) (Reference Paxinos and Franklin46). Sections were thaw-mounted onto Superfrost Plus slides (VWR International ApS, Soeborg, Denmark) and stored at −80°C until further processing.
SST and SSTR in situ hybridisation
In situ hybridisation was conducted as described previously with minor modifications (Reference Christensen, Olesen, Kristiansen, Mikkelsen and Woldbye47,Reference Woldbye, Nanobashvili and Sørensen48). The slides were defrosted for 30 min at room temperature (RT) and post-fixed in ice-cold 4% paraformaldehyde for 5 min, rinsed briefly in 1×PBS and placed in 1×PBS for 5 min. Then the slides were placed in 70% ethanol (EtOH) for 5 min before they were stored in 95% EtOH at 4°C until hybridisation. The following synthetic DNA antisense oligonucleotide probes were used; SST mRNA: 5'-CCG-CCA-GAG-ACT-TCT-GCA-GAA-ACT-GAC-GGA-GTC-TGG-GGT-CCG-3' (Reference Mikkelsen and Woldbye5) and 5'-GTC-TTC-CAG-AAG-AAG-TTC-TTG-CAG-CCA-GC-3' (Reference Pannell, Simonian, Gillies, Luscher and Herbison49), SSTR1 mRNA: 5'-GCC-TCC-AGA-CTC-CAG-ATT-CTC-GGG-CTG-GAA-GTC-CTC-CAC-G-3', SSTR2 mRNA: 5'-GGC-GTT-GCT-TGT-CAT-GTC-GTA-GTA-TGG-CTC-GGT-CTG-GTT-G-3' SSTR3 mRNA: 5'-TTC-TTC-ATC-CTC-CTC-CTC-TTC-AGT-CTT-CTC-TGG-AGG-TCC-C-3' (Reference Hannon, Petrucci, Fehlmann, Viollet, Epelbaum and Hoyer37) and SSTR4 mRNA: 5'-CCA-CAT-AGA-AAG-GCA-TCC-AGC-ATA-GCA-CAA-AGA-CGG-TCA-CCA-3' (Reference Bates, Kegg, Petrevski and Grady50) (DNA Technology, Riskkov, Denmark). The probes were labelled in the 3'-end with [α35S]dATP (1250 Ci/mmol; Perkin Elmer, Skovlunde, Denmark) by the use of terminal deoxynucleotidyl-transferase (Roche Diagnostics, Germany) and added to a specific activity of 105 cpm/μl to the hybridisation buffer containing 50% formamide (v/v), 4×saline sodium citrate (1×SSC=0.15 M NaCl, 0.015 M sodium citrate-2H2O, pH=7.0), 10% dextran sulphate (v/v) and 10 mM dithiotretiol. Each slide was covered with 120 μl hybridisations buffer, coverslipped with parafilm and left overnight at 42oC. The following day, slides were briefly rinsed in 1×SSC, transferred to 1×SSC at 60°C for 30 min and rinsed in 1×SSC, 0.1×SCC, 70% EtOH and 95% EtOH for 1 min at RT. Finally, sections were allowed to air-dry for at least 30 min before exposing them, together with 14C microscales (Amersham Lifescience), to 35S-sensitive Kodak BioMax MR film (Sigma-Aldrich, Soeborg, Denmark) for 4 (SST, SSTR2, SSTR3 and SSTR4) or 6 weeks (SSTR1) at −4°C, before being developed in Kodak GBX developer. Using computer-assisted image analysis, mRNA levels were determined by measuring optical density (Bq/g) bilaterally in at least four adjacent sections from each animal over the dentate hilus (for SST mRNA), dentate granular layer (for SSTR mRNAs), hippocampal CA3 and CA1 (pyramidal layers), parietal cortex (all layers) corresponding to primary somatosensory cortex in the atlas of Paxinos and Franklin (Reference Cammalleri, Martini, Timperio and Bagnoli41), and piriform cortex (all layers). A person blinded to the treatment of the animals performed all measurements. The specificity of the oligoprobes was confirmed by addition of corresponding unlabelled antisense probes (competitive controls).
SST immunoflourescence
SST immunofluorescence was performed as previously described with minor modifications (Reference Hundahl, Fahrenkrug and Hannibal51). The slides were defrosted for 10 min at RT and subsequently fixed in 4% paraformaldehyde for 10 min. Then, the slides were washed twice in PBS for 5 min before incubation for 30 min in PBS buffer containing 4% bovine serum albumin and 0.3% Triton X-100 (incubation buffer). After adding goat anti-SST antibody (1 : 500; Santa Cruz Biotechnology, Dallas, TX, USA) in incubation buffer to the slides they were incubated overnight at 4°C. The slides were subsequently washed three times in washing buffer (1% bovine serum albumin, 0.3% Triton X-100 in PBS) for 5 min, incubated with Alexa-conjugated 488 anti-goat antibody (1 : 200; Invitrogen, Taastrup, Denmark) in incubation buffer for 1 h and washed twice in PBS for 5 min. Finally, cell nuclei were counterstained with DAPI (Southern Biotech, Birmingham, AL, USA) and the slides were mounted with anti-fade mounting medium (DAKO, Glostrup, Denmark) and digital images were obtained using a Zeiss Axio Scan.Z1 slide scanner. A person blind to treatment counted the number of SST-ir cells semi-quantitively bilaterally in the hippocampal hilus of each section (n=2–6 sections per animal) as visualised with Zeiss proprietary Zen software (blue edition).
SST binding
SST autoradiography was essentially performed as previously described (Reference Hannon, Petrucci, Fehlmann, Viollet, Epelbaum and Hoyer37). Slides were defrosted for 30 min at RT before being preincubated for 20 min in binding buffer (pH=7.4) containing 50 mM Tris–HCl, 2 mM EGTA, 5 mM MgCl2, 0.1 mM bacitracin and 0.2% bovine serum albumin. Slides were then incubated for 2 h at RT in binding buffer containing 50 pM [125I]LTT-SST28 ([Leu8, D-Trp22,125I-Tyr25]-SST28, 2200 Ci/mmol; ANAWA Trading SA, Wangen, Switzerland) to visualise total binding, or supplemented with 1 μM SST28 (American Peptide, Sunnyvale, CA, USA) to visualise non-specific binding. After a brief rinse in ice-cold dH2O, the slides were washed in binding buffer for 2×10 min at RT, and then briefly rinsed in ice-cold dH2O before being air-dried. Finally, the slides were exposed to 125I-sensitive BioMax MS films (Sigma-Aldrich, Denmark), together with 125I-microscales, for 7 days at 4oC before being developed in Kodak GBX developer. SST binding was quantified using a computer-assisted imaging system (ScionImage; NIH, Bethesda, MD, USA) measuring optical density (Bq/g) in at least four adjacent sections from each mouse bilaterally over the dorsal dentate gyrus (molecular layer), CA3 (pyramidal layer and strata oriens, radiatum, and lucidum), CA1 (pyramidal layer and strata oriens and radiatum), parietal cortex (defined as above; all layers) and piriform cortex (all layers). Specific SST binding was calculated by subtracting non-specific binding from total measured binding. Measurements were performed by a person blinded to the treatment of the animals.
Statistical analysis
Data of SST and SSTR1–4 mRNA expression, and SST binding were analysed using two-way analysis of variance (ANOVA) followed by Bonferroni-adjusted post-hoc t-test. One-way ANOVA followed by Dunnett’s post-hoc test was used to analyse SST immunoflourescence data. The level of significance was set at p<0.05, and data are presented as mean±standard error of mean.
Results
SST and SSTR1–4 mRNA expression
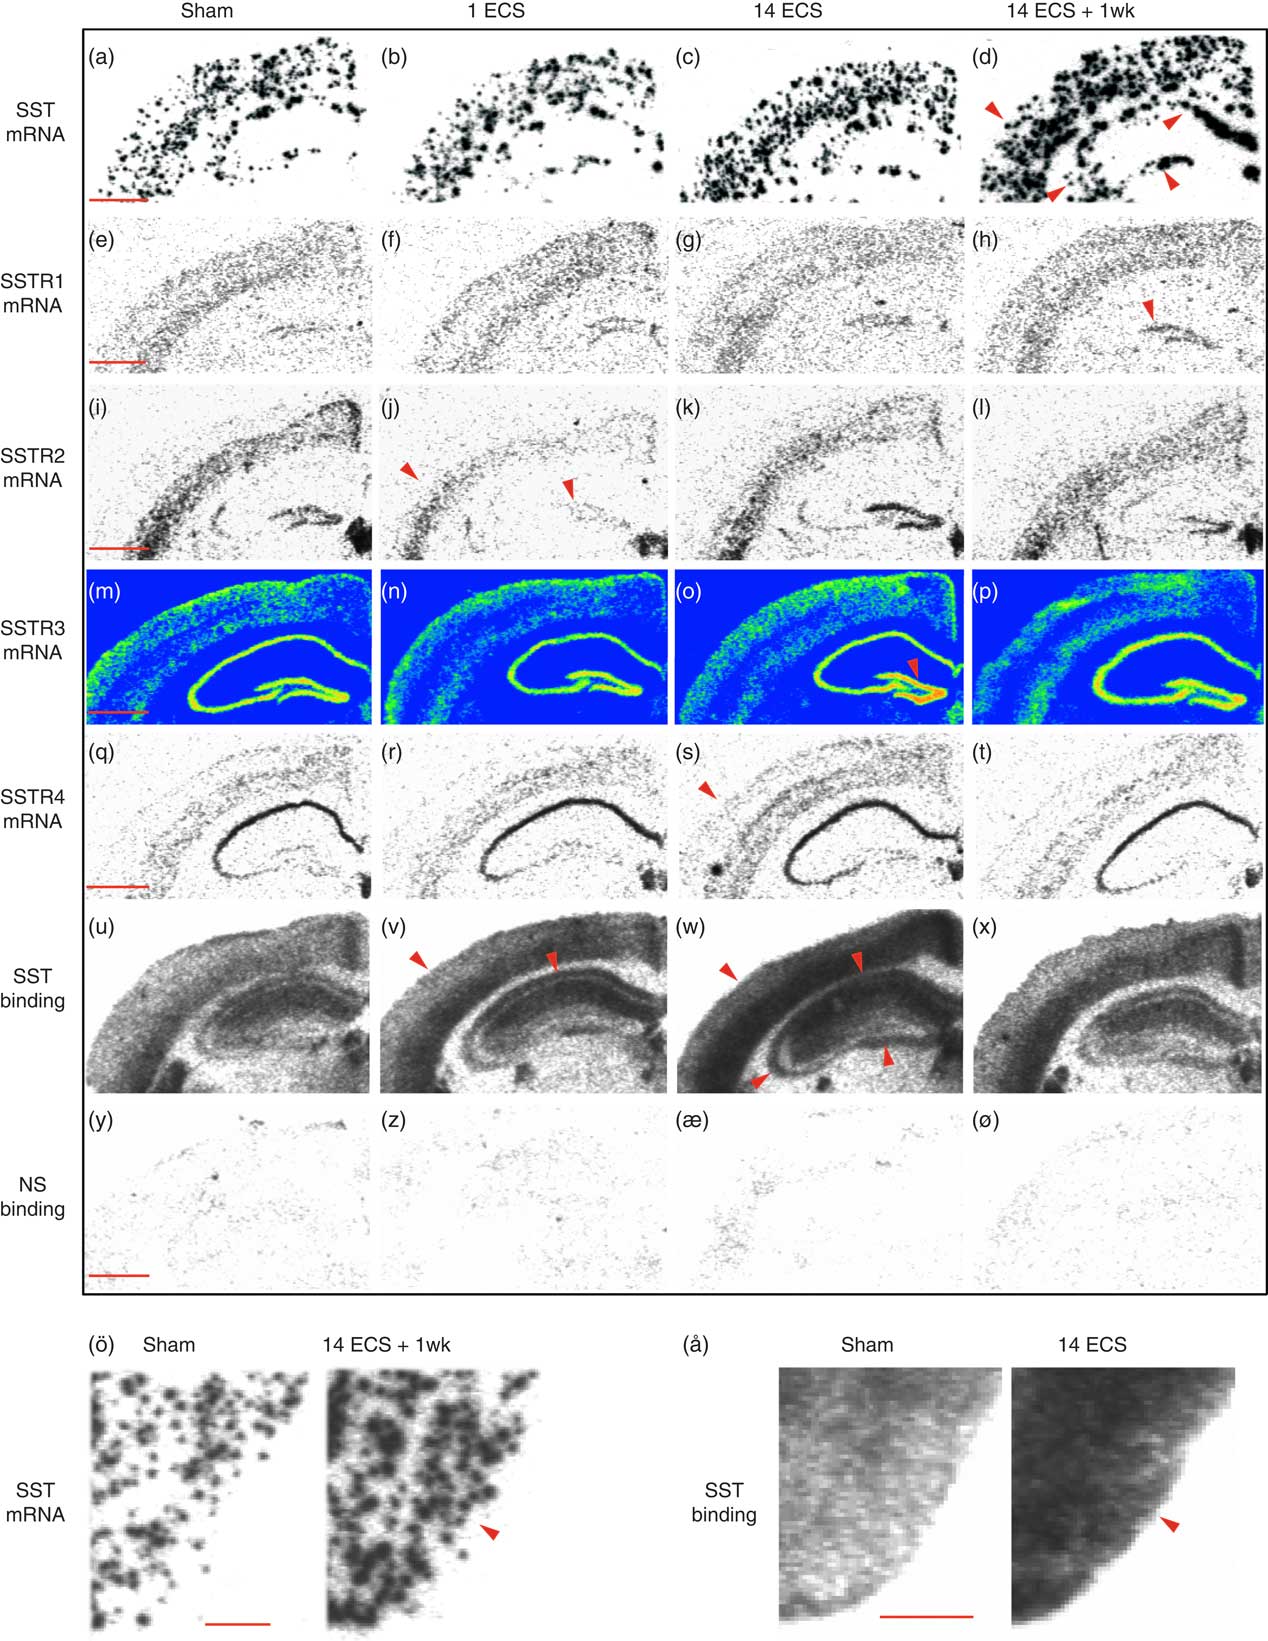
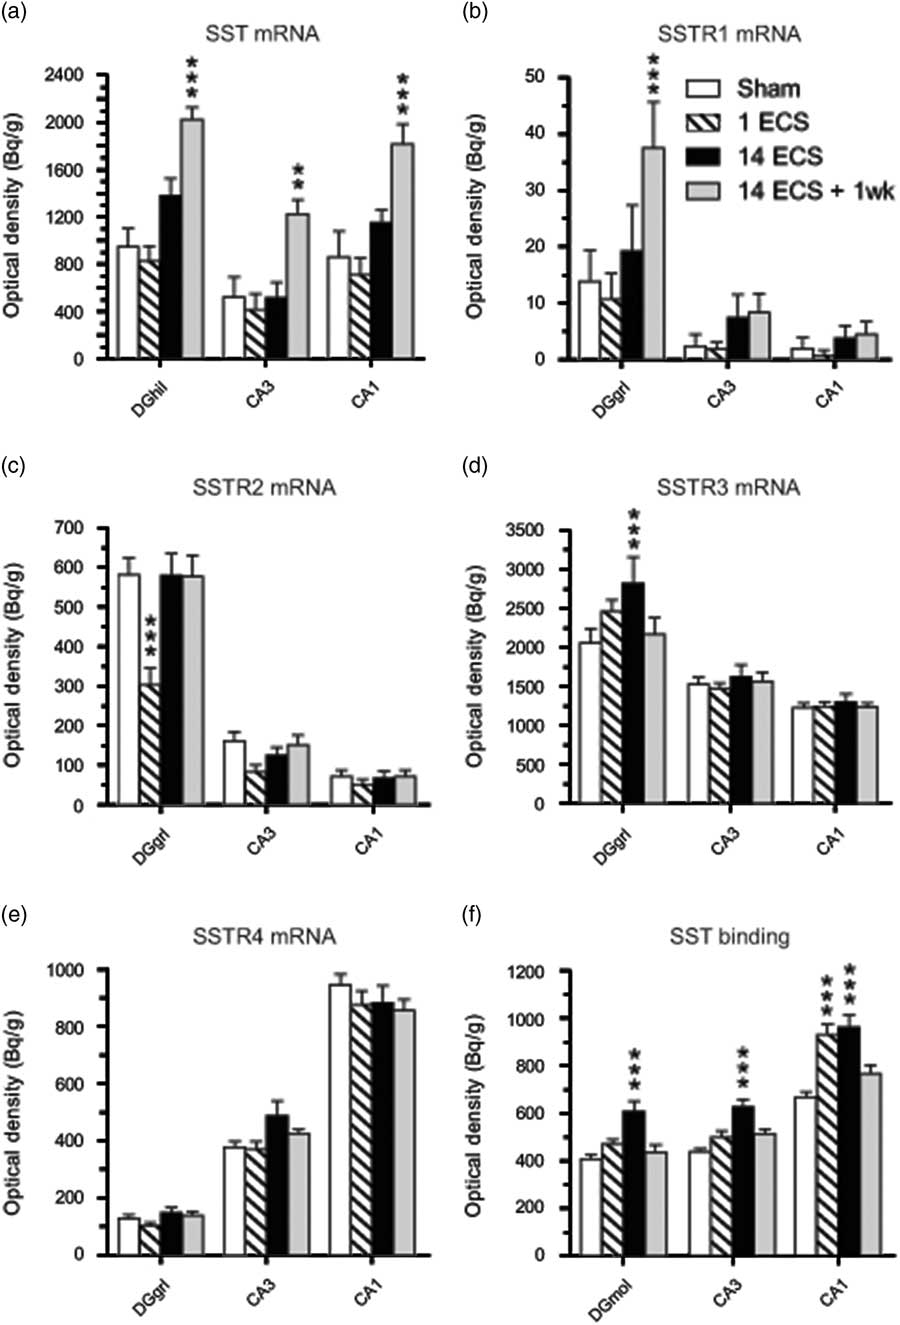
Single ECS was associated with significant decreases in SSTR2 mRNA levels in the dentate granular layer (48%, p<0.001, 95% CI [206, 400]; Figs 1i, j and 2c) and parietal cortex (47%, p<0.001, 95% CI [68.2, 167]; Figs 1i, j and 3c) compared with sham (dentate granule cell layer: 95% CI [484, 678], parietal cortex: 95% CI [164, 284]), returning toward sham levels after repeated ECS. This tendency was also seen in the CA3 (48%) and piriform cortex (47%), but did not reach significance (Figs 2c and 3c, respectively).

Fig. 1 Autoradiograms show somatostatin (SST) and SSTR1–4 mRNA expression as well as 125I-LTT-SST28 binding in the dorsal hippocampus of mice treated with sham, single electroconvulsive stimulation (ECS), chronic ECS, and chronic ECS+1 week. Rows represent SST mRNA (a–d), SSTR1 mRNA (e–h), SSTR2 mRNA (i–l), SSTR3 mRNA (m–p), SSTR4 mRNA (q–t), as well as 125I-LTT-SST28 binding (u–x) and corresponding non-specific binding (y–ø) whereas columns represent the four different treatments Sham (a–y), single ECS (b–z), chronic ECS (c–æ), and chronic ECS+1 week (d–ø). SST mRNA and binding in the piriform cortex of rats treated with sham and chronic ECS are shown in ö and å, respectively. Red arrowheads represent significant changes compared with sham treatment. Scale bar=1 mm (a–ø) and 0.5 mm (ö, å). SSTR, synthesis of SST receptors.

Fig. 2 Graphs show effects of sham, single electroconvulsive stimulation (ECS), repeated ECS, and repeated ECS+1 week on somatostatin (SST) (a) and SSTR1 (b), SSTR2 (c), SSTR3 (d), and SSTR4 (e) mRNA expression as well as 125I-LTT-SST28 binding (f) in the dorsal hippocampus of mice. All values are mean±SEM. **p<0.01, ***p<0.001, two-way analysis of variance followed by Bonferroni post-hoc t-test. SSTR, synthesis of SST receptor; DGhil, hilus of the dentate gyrus; DGgrl, granular layer of the dentate gyrus; DGmol, molecular layer of the dentate gyrus.
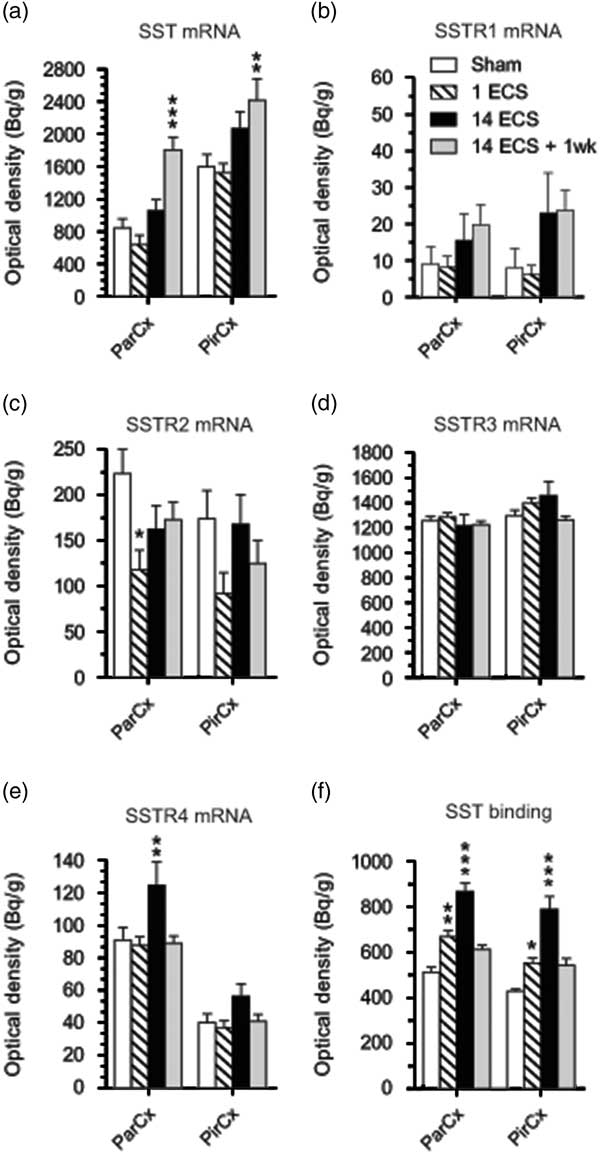
Fig. 3 Graphs show effects of sham, single electroconvulsive stimulation (ECS), repeated ECS, and repeated ECS+1 week on somatostatin (SST) (a), SSTR1 (b), SSTR2 (c), SSTR3 (d), and SSTR4 (e) mRNA expression as well as 125I-LTT-SST28 binding in the parietal and piriform cortices of mice. All values are mean±SEM. *p<0.05, **p<0.01, ***p<0.001, two-way analysis of variance followed by Bonferroni post-hoc t-test. SSTR, synthesis of SST receptor; ParCx, parietal cortex; PirCx, piriform cortex.
Twenty-four hours after repeated ECS, significant increases were found in SSTR3 mRNA expression in the dentate granular layer (37%, p<0.01, 95% CI [2051, 3582]; Figs 1m, o and 2d) as well as in SSTR4 mRNA expression in parietal cortex (37%, p<0.01, 95% CI [92.8, 157]; Figs 1q, s and 3e), compared with sham (SSTR3 mRNA: 95% CI [1639, 2471], SSTR4 mRNA: 95% CI [73.6, 108]). These elevated levels returned to sham levels by 1 week after repeated ECS (Figs 1t and 3e).
Most changes in gene expression were observed 1 week after repeated ECS, when increased levels of SST mRNA were found in the dentate hilus (113%, p<0.001, 95% CI [1167, 2278]), hippocampal CA3 (134%, p<0.01, 95% CI [926, 1519]) and CA1 (111%, p<0.001, 95% CI [1401, 2228]) (Figs 1a, d and 2a), as well as parietal (113%, p<0.001, 95% CI [1423, 2186]) and piriform (51%, p<0.001, 95% CI [1777, 3061]) cortices (Figs 1a, d, ö and 3a), as compared with sham-treated mice (dentate hilus: 95% CI [573, 1326], CA3 : 95% CI [116, 931], CA1 : 95% CI [326, 1395], parietal coretx: 95% CI [569, 1122], piriform cortex: 95% CI [1224, 1974]. Neither single nor repeated ECS induced significant changes in SST mRNA expression in hippocampal or cortical regions (Figs 1b, c, 2a, and 3a). Similarly, SSTR1 mRNA levels were increased 1 week after repeated ECS in the dentate granular layer (170%, p<0.01, 95% CI [19.1, 55.8]; Figs 1e, h and 2b) compared with sham-treated mice (95% CI [1.45, 26.3]) whereas no changes were found with other treatments or in other brain regions (Figs 1e–h, 2b, and 3b).
SST immunofluorescence
One week after repeated ECS a significant increase in the number of hilar SST-ir cells per hilus was found (39%, p<0.05, 95% CI [7.73, 13.4]) as compared with sham (95% CI [6.06, 9.14]) while the number of SST-ir cells was not affected 24 h after single and repeated ECS (Figs 4a–c).
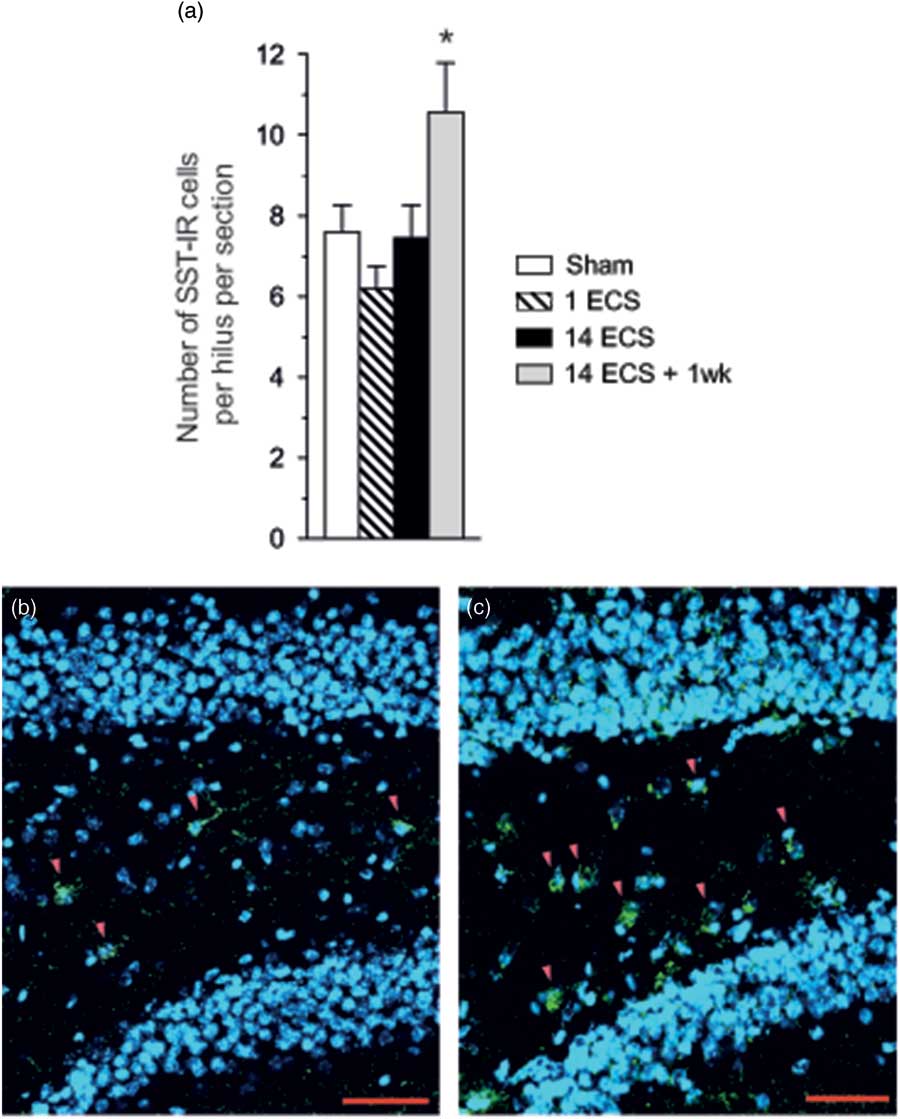
Fig. 4 Graph shows the number of SST-ir cells per hilus in the dorsal hippocampus of mice after sham, single electroconvulsive stimulation (ECS), repeated ECS, and repeated ECS+1 week (a). All values are mean±SEM. *p<0.05, one-way analysis of variance followed by Dunnett’s post-hoc test. Photos show SST-ir cells in the dentate hilus (red arrowheads) after sham (b) or repeated ECS+1 week (c). SST immunoreactivity is green, and nuclei stained with DAPI are blue. Scale bar=50 µm. SST, somatostatin.
SST binding
Single ECS caused significant increases in specific [125I]LTT-SST28 binding in the CA1 (39%, p<0.001, 95% CI [833, 1027]; Figs 1u, v and 2f), as well as parietal (31%, p<0.01, 95% CI [609, 730]; Figs 1u, v and 3f) and piriform cortices (29%, p<0.05, 95% CI [498, 605]; Fig. 3f), as compared with sham-treated mice (CA1 : 95% CI [617, 719], parietal cortex: 95% CI [464, 561], piriform cortex: 95% CI [404, 450]). At 24 h after repeated ECS the effect was even bigger, with increased specific [125I]LTT-SST28 binding occuring in all studied regions (dentate molecular layer: 49%, p<0.001, 95% CI [516, 703]; CA3 : 43%, p<0.001, 95% CI [553, 701]; CA1 : 44%, p<0.001, 95% CI [845, 1077]; parietal cortex: 69%, p<0.001, 95% CI [782, 951]; piriform cortex: 85%, p<0.001, 95% CI [662, 917]) (Figs 1u–ø, å, 2f and 3f) as compared with sham-treated mice (dentate molecular layer: 95% CI [365, 451]; CA3 : 95% CI [409, 468]; CA1 : 95% CI [617, 719]; parietal cortex: 95% CI [464, 561]; piriform cortex: 95% CI [404, 450]). One week after repeated ECS, specific [125I]LTT-SST28 binding appeared to remain slightly increased in the CA3/CA1 and cortical areas, but did not reach significance.
Discussion
The present study is the first to explore the effects of ECS on the SST system in mice. Single or 14 repeated ECS were found to cause differential changes in SST and SSTR1–4 gene expression as well as SST binding in hippocampal regions and piriform/parietal cortical regions. Increased SST gene expression was consistently observed at 1 week after repeated ECS in all examined brain regions while no changes were observed 24 h after one single ECS or 14 repeated ECS. We confirmed that SST mRNA changes were translated into SST peptide synthesis in the dentate hilus where an increase in the number of SST-ir cells was found 1 week after repeated ECS but not in the other groups. It remains to be determined whether the increased number of SST-ir cells is due to de novo expression of SST in new hilar interneurons or whether these cells already expressed SST but below the threshold for detection. Nonetheless, consistent with these findings in mice, former studies showed augmented SST mRNA levels or SST immunoreactivity in rats treated with repeated ECS but not after single ECS (Reference Mikkelsen and Woldbye5,Reference Kragh, Tønder, Finsen, Zimmer and Bolwig28–Reference Zachrisson, Mathé, Stenfors and Lindefors31). In a previous rat study by one of the authors (Reference Mikkelsen and Woldbye5), analysis of old data showed that SST gene expression in the dentate hilus of rats treated with 14 ECS compared with 14 sham-ECS was also not significantly elevated when studied 24 h after the last ECS (14 ECS: 208±38 nCi/g, 14 sham: 141±9 nCi/g; Student’s t-test: t=1.91, df=7, p=0.10). Likewise, in the piriform cortex of the same former rat ECS study, 14 ECS did also not cause a significant increase in SST mRNA. It is not clear why the increase in SST mRNA was not detectable before after 1 week. However, in a rat kainate seizure model, expression of SST mRNA and SST immunoreactivity was also not significantly increased in several brain regions, including the subiculum, 24 h after application of kainate, but were, instead, found to gradually increase over time from 8 days up to 3 months (Reference Drexel, Kirchmair, Wieselthaler-Hölzl, Preidt and Sperk52).
No previous studies have investigated the effects of ECS on SSTR1–4 gene expression in the mouse brain. Differential changes were observed with regard to all four studied SSTRs after ECS. Thus, single ECS caused decreased levels of SSTR2 mRNA in both the dentate granular layer and parietal cortex. In contrast, repeated ECS (+24 h) resulted in increased SSTR3 and SSTR4 mRNA levels in the dentate granular layer and parietal cortex, respectively, and repeated ECS (+1 week) caused increased SSTR1 mRNA levels in the dentate granular layer. It should be noted that repeated sham treatment may act as a stressor having delayed effects on the expression of SST and SSTR1 mRNA expression 1 week after repeated ECS. However, we have previously reported (Reference Mikkelsen and Woldbye5) that repeated sham treatment (14×) causes an increase in SST mRNA expression compared with treatment naïve animals. As the mice treated with sham-ECS in the present study were handled daily (also during the 1 week of habituation), allowing adaption to stressful events, we consider it unlikely that our observation results from stress-related effects. To what extent these changes translate into changes in subtype-specific SSTR binding remains to be studied. Nonetheless, consistent increases in SST binding were observed after single and/or repeated ECS (+24 h) in all studied regions, suggesting that overall at 24 h after single or repeated ECS, SST could cause increased signalling. There was poor correlation between changes in SST binding and individual SSTR mRNA levels except for in the dentate granular layer and parietal cortex after repeated ECS (+24 h) when SST3 mRNA and SST4 mRNA levels were also elevated, respectively. This suggests that increases in SST binding after ECS could be due to mechanisms other than increased gene expression (e.g. increased SSTR affinities, reduced SSTR internalisation).
The functional consequences of the complex neuroplastic changes observed in the SST system after ECS remain to be determined. However, considering the inhibitory effect of SST on excitatory neurotransmission and seizures (Reference Vezzani and Hoyer19), it is likely that the changes could be implicated in regulating regional excitability in the hippocampus and piriform cortex, two central regions for regulation of seizure activity (Reference Gale38,Reference Löscher and Ebert39). Regulations in the neocortex (i.e. parietal cortex) could also influence seizure spread. Consistent with this interpretation 14 repeated ECS has previously been shown to be associated with anticonvulsive effect in kainate-induced seizures 24 h after the last ECS in rats (Reference Mikkelsen and Woldbye5). As SST binding was increased 24 h after the last repeated ECS in all regions studied in the present study, this could contribute to an anticonvulsant effect of ECS. This effect might remain at 1 week after repeated ECS as SST mRNA levels were increased in all regions although SST binding was back to sham levels. Consistent with the interpretation that increased SSTR binding after ECS may be associated with reduced neuronal excitability, a previous study found that the opposite condition, that is increased seizure susceptibility after kainate-induced seizures, was accompanied by decreased SSTR binding in the hippocampal CA3 and CA1 (Reference Pérez, Vezzani, Tutka, Rizzi, Schüpbach and Hoyer53).
The SSTRs that may mediate the anticonvulsant effect of SST in mice have not fully been elucidated. Species differences between mice and rats appear to contribute to blurring the picture (Reference Aourz, DE Bundel and Stragier40). However, in mice, the SSTR4 plays a major role while SSTR2/SSTR3 (Reference Qiu, Zeyda, Johnson, Hochgeschwender, De Lecea and Tallent43) and SSTR1 (Reference Cammalleri, Martini, Timperio and Bagnoli41) also contribute. In addition, functional cooperation has been suggested to occur between SSTR3/SSTR4 and SSTR2 in mediating anticonvulsant effects (Reference Aourz, DE Bundel and Stragier40). The observed pattern of SSTR subtype regulation after ECS in the present study does not present a clear picture and measurements of SSTR subtype protein levels and functionality could throw further light on whether regulations occur that specifically relate to seizure control.
The working mechanisms of ECT remain to be determined. However, according to one hypothesis, anticonvulsant effects of ECT could play a role (Reference Mikkelsen and Woldbye5,Reference Sackeim, Decina, Prohovnik, Malitz and Resor6). The anticonvulsive effect observed during a course of ECT is marked by an increase in seizure threshold and a decrease in seizure duration (Reference Sackeim8). This has led to the proposal that neurotransmitter systems behind these effects may be involved in the beneficial effects of ECT (Reference Sackeim, Luber and katzman7,Reference Sackeim8). Taken together with previous studies demonstrating ECS-related upregulations of other anticonvulsant neuropeptides like neuropeptide Y, galanin, and thyrotropin releasing hormone are upregulated (Reference Bolwig, Woldbye and Mikkelsen9–Reference Mathé, Husum and El Khoury11,Reference Sattin13,Reference Veronesi, Aldouby, Domb and Kubek14), our results indicate that ECS-induced alterations in the SST system might also contribute to the therapeutic effect of ECT. However, it remains to be determined to what extent the changes in the SST system are involved in the therapeutic effects of ECT. In conclusion, the present study shows that ECS-induced neuroplastic changes in SST and its receptors, yet another antiepileptic neuropeptide system, could also play a role.
Acknowledgement
The authors thank Birgit H. Hansen for excellent technical assistance.
Authors’ Contribution: M.V.O. contributed to study design, performed the majority of the experiments, analysed the results as well as drafting of the article and final approval. D.P.D. designed the study, contributed to interpretation of the results as well as drafting of the article and final approval. SST immunoflourescence was conducted by C.R.G. and S.H.C who also did final approval of the article. All authors met the ICMJE authorship criteria.
Financial Support
The project was supported by grants from the Danish Medical Research Council [64750], Ivan Nielsen Foundation, Psychiatric Basic Research Foundation, Dr. Sophus Carl Emil Friis and His Wife Olga Doris Friis’s Foundation, Hede Nielsen Family Foundation, Aase and Ejnar Danielsen Foundation, Danish Research Foundation.
Conflicts of Interest
All authors declare that they have no conflict of interest.
Ethical Standards
All experiments were performed in accordance with guidelines from the Danish Animal Experimentation Inspectorate and approved by the local Ethical Committee for Experimental Animals. This study is in compliance with the ARRIVE (Animal Reseach: Reporting In Vivo Experiments) guideines.
Supplementary material
To view supplementary material for this article, please visit https://doi.org/10.1017/neu.2018.1