


Significant outcomes
-
∙ This study showed an increased α2-adrenoceptor binding across regions in the female Flinders-sensitive line (FSL) animals compared with control Sprague-Dawley (SD) rats.
-
∙ Increased binding in the FSL rats is in line with binding studies of brains from depressed suicide victims.
-
∙ Surprisingly, the density was further increased in Flinders-resistant line control rats when compared with both FSL and SD rats.
Limitations
-
∙ The animals used in this study were the sham controls of another study, and they were, therefore, handled daily for 10 days before the brains were removed.
-
∙ The sample size was small in some groups of animals, which might have masked significance in some regions.
-
∙ Female rats were studied because of the higher incidence rates of depression in females, making it difficult to compare data with previous studies carried out entirely on male animals.
Introduction
The World Health Organization expects that by 2030 depression will be the main burden of disease worldwide and the leading cause of ‘Years of life lived with disability’ (1). Today, ~350 million people globally are estimated to suffer from depression. Clinical symptoms can include anhedonia (i.e. inability to experience pleasure), feelings of guilt and low self-esteem, anxiety, disturbed sleep architecture and appetite, and suicidal ideation (Reference Marcus, Yasamy, van Ommeren, Chrisholm and Saxena2).
In the last 50 years, the monoamine hypothesis has dominated the understanding of the pathophysiology of depression, suggesting that a deficiency in monoamine transmission in the brain may lead to depression (Reference Schildkraut3). Studies on the distribution of the monoaminergic receptors and transporters in the limbic, thalamic, and cortical neuronal circuits support that impairments in the serotonergic and noradrenergic systems are involved in the behavioural manifestations of depression (Reference Drevets4).
Animal models simulating features of depressive disorders have been used in the study of the neurochemical mechanisms involved in depression. An example of a genetic model used to induce a partial depressive phenotype is the Flinders-sensitive line (FSL) rat model. Originally, the FSL rats and Flinders-resistant line (FRL) rats were selectively bred on a Sprague-Dawley (SD) background to differ in their sensitivity to an anticholinesterase compound (Reference Overstreet, Russell, Helps and Messenger5). The FSL rats represent an animal model of depression with cholinergic supersensitivity (Reference Overstreet and Russell6,Reference Wegener, Mathe and Neumann7), which is also a predisposing factor to depression in humans (Reference Janowsky, Overstreet and Nurnberger8). Since the 1980s, the FRL has been used as a control strain for FSL in behavioural and biological studies as often as the background SD strain (Reference Pucilowski, Overstreet, Rezvani and Janowsky9–Reference Matthews, Baldo, Markou, Lown, Overstreet and Koob11).
The FSL rat model meets the major criteria of high face, construct, and predictive validities for research on behavioural, neurochemical, and pathophysiological features of depression (Reference Wegener, Mathe and Neumann7,Reference Overstreet, Friedman, Mathe and Yadid10,Reference Overstreet and Wegener12). In addition, the FSL rat exhibits certain characteristics analogous to depressed individuals – for instance, reduced appetite, disrupted sleep patterns, reduced activity, and abnormal immune function. Some antidepressant treatments can reverse the depressive behaviour of increased immobility in the forced swim test (Reference Wegener, Mathe and Neumann7,Reference Overstreet, Keeney and Hogg13) and the suppression of neuronal plasticity in the FSL rats (Reference Chen, Madsen, Wegener and Nyengaard14), reflecting the predictive validity for traditional antidepressant drug screening.
Among the symptoms of major depression are disruptions in attention, memory, and sleep, which are in part controlled by the central noradrenergic system. Post-mortem studies in the brains of suicide victims with major depressive disorder have confirmed increased α2-adrenergic receptor density in the temporal and prefrontal cortex (Reference Meana and Garcia-Sevilla15,Reference De Paermentier, Mauger, Lowther, Crompton, Katona and Horton16), hippocampus (Reference Gonzalez, Pascual and Meana17), and locus ceruleus (Reference Ordway, Widdowson, Smith and Halaris18). Moreover, De Paermentier et al. (Reference De Paermentier, Mauger, Lowther, Crompton, Katona and Horton16) found that antidepressant-treated suicide victims had significantly lower levels of α2-adrenoceptors in the cortex, hippocampus, caudate, and amygdala compared with controls, suggesting a normalising effect of antidepressants on the α2-adrenoceptors. Pre-clinically, Subhash et al. (Reference Subhash, Nagaraja, Sharada and Vinod19) also found a decrease in α2-adrenoceptors in cortical areas, but not in hippocampal areas, in the adult male rat brain after chronic treatment with tricyclic antidepressants. Conversely, other studies found no difference in α2-adrenoceptor binding in suicide victims compared with controls (Reference Arango, Ernsberger, Sved and Mann20,Reference Klimek, Rajkowska and Luker21), and results remain inconclusive, probably due to the heterogeneities in depressive phenotypes, causes of death, and lack of complete knowledge about ante-mortem drug exposure(s).
The α2-adrenoceptors have a widespread distribution throughout the brain: they are localised pre-synaptically on noradrenergic nerve terminals and on the cell body of noradrenergic neurons of the pontine nuclei such as locus ceruleus, allowing them to modulate the release of noradrenaline via a negative-feedback mechanism (Reference Langer22). In the terminal projection areas, they are localised either pre-synaptically on afferent dopaminergic and serotonergic terminals or post-synaptically on intrinsic cell bodies (Reference Frankhuyzen and Mulder23,Reference Gresch, Sved, Zigmond and Finlay24). The vast majority of α2-adrenoceptors are located post-synaptic to noradrenaline terminals (Reference Arnsten, Scahill and Findling25).
Aims of the study
This study aimed to investigate the densities of α2-adrenoceptors in different brain regions of the female FSL rats compared with its two traditional control groups – female FRL rats and SD rats. A single concentration binding study with the selective tritiated α2-adrenoceptor antagonist, [3H]RX 821002, was used in an attempt to further investigate the noradrenergic system in the FSL rat model of depression.
Methods and Materials
Animals
This study was approved by the Danish Committee on Ethics in Animal Experimentation (2007/561-1378). Adult (12–14 weeks old at the start of the study) female FSL rats (n=8) and FRL rats (n=6) from breeding colonies maintained in the animal quarters of the Centre for Psychiatric Research, Aarhus University Hospital, were used along with female SD rats (n=5) from Taconic farms located in Denmark. They were kept on a normal 12-h light/12-h dark cycle and had free access to food and water. Rats were housed two per cage (average weight: 200–250 g). All the animals used in this study were from groups of animals that received sham treatment as part of another study about the effects of electroconvulsive shocks (Reference Lillethorup, Iversen, Fontain, Wegener, Doudet and Landau26). The sham animals were handled once daily for 1–2 min for 10 consecutive days and had ear clips briefly attached but no current was passed.
Tissue preparation
Within 48 h of the last sham session, the rats were decapitated using a guillotine. The brains were rapidly removed and cut along the sagittal midline into two hemispheres after removing the cerebellum. The hemispheres were then flash-frozen using isopentane cooled to −40°C with dry ice and stored at −80°C until further processing. Each hemisphere was cut into 20-µm-thick coronal sections using a cryostat (Microm HM 500 OM Cryostat, Microm, Walldorf, Germany) at −20°C and thaw-mounted on Polysine adhesion microscope slides (Thermo Scientific, Braunschweig, Germany). The slides were stored at −80°C until the binding studies were performed.
Autoradiography
Slices at the approximate levels of the frontal cortex (FC, anterior–posterior: 12.24–11.76 mm), the insular cortex (IC, anterior–posterior: 12.24–11.76 mm), the perirhinal cortex (PRh, anterior–posterior: 6.00–5.76 mm), the basolateral amygdaloid nucleus (BLA, anterior–posterior: 6.00–5.76 mm), the medial amygdaloid nuclei (MeA, anterior–posterior: 6.00–5.76 mm), the ventromedial hypothalamic nucleus (VMH, anterior–posterior: 6.00–5.76 mm), the laterodorsal thalamic nucleus (LDT, anterior–posterior: 6.00–5.76 mm), and the dorsal hippocampus (HIPP, anterior–posterior: 6.00–5.76 mm) were selected according to the stereotaxic co-ordinates of the rat brain atlas (Reference Paxinos and Watson27) (Fig. 1). For each region, two adjacent slides were used to measure total binding and a third was used to measure non-specific binding.
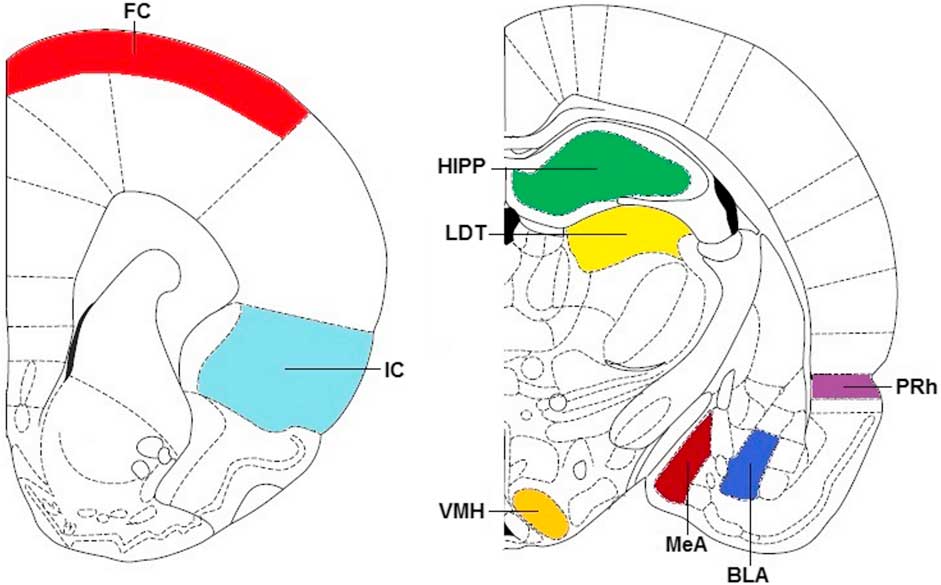
Fig. 1 A schematic presentation of the regions investigated as FC, IC, HIPP, LDT, VMH, MeA, BLA, and PRh. Adapted from Paxinos rat brain atlas at anterior–posterior: 12 (left) and 6.00 mm (right) (Reference Paxinos and Watson27). FC, frontal cortex; IC, insular cortex; HIPP, hippocampus; LDT, laterodorsal thalamic nucleus; VMH, ventromedial hypothalamic nucleus; MeA, medial amygdaloid nucleus; BLA, basolateral amygdaloid nucleus; PRh, perirhinal cortex.
In vitro autoradiography was carried out according to the method of Booze et al. (Reference Booze, Wallace, Silvers, Strupp, Snow and Mactutus28) with some modifications. In brief, the slides were thawed at room temperature (22°C) for 5 min and pre-incubated in baths containing 25 mM GLYGLY (Sigma-Aldrich, St. Louis, MO, USA) buffer (pH 7.6) for 5 min. The incubations with 2 nM [3H]RX 821002 (Specific activity: 40–70 Ci/mmol; PerkinElmer, Skovlunde, Denmark) were carried out at 22°C in the same buffer for 90 min. Non-specific binding was determined by the addition of 10 µM unlabelled phentolamine (Sigma–Aldrich). After incubation, the slides were washed twice for 2 min in fresh buffer (4°C), rinsed quickly in distilled water (4°C) to remove buffer salts, dried under a steam of cold air, and stored overnight for further drying under vacuum. On day 2, the slides were placed in standard film cassettes (BAS-Cassette 2025; Fujifilm, Tokyo, Japan) along with Tritium standards (American Radiolabeled Chemicals, St. Louis, MO, USA) and exposed to blank tritium storage phosphor screens (BAS-IP TR2025 Fuji Imaging Plate; Fujifilm Corporation, Tokyo, Japan) for 6 days at room temperature. On day 7, the screens were removed from the cassettes and scanned immediately using a Fujifilm BAS-5000 Phosphoimager (Fujifilm, Tokyo, Japan).
Autoradiography analyses
The imaging plates were analysed using the software ImageGauge 4.0 provided with the imager. Photostimulated luminescence values per mm2 obtained after background subtraction were calibrated using the Tritium microscales with concentrations ranging from 0.1 to 15.9 µCi/g (American Radiolabeled Chemicals, Saint Louis, MO, USA). As mentioned above, the total binding was measured in manually drawn regions of interest encompassing the PRh, layer II-III of the FC, the IC, the BLA, the MeA, the VMH, the LDT, and a HIPP region covering the CA1-CA3 fields (Fig. 1). Non-specific binding for each rat was measured on the slides incubated with both tracer and blocker: circular regions were drawn on each brain slice, as the non-specific binding was homogeneous and an average for each region was made for each rat. These averages were subtracted from the average total binding measurements for corresponding rats to find the specific binding levels. Some slides were excluded due to tissue damage during the cryostat sectioning.
Statistical analyses
Initially, the groups were confirmed to be normally distributed using the Normal Q–Q Plot and the Shapiro–Wilks test and to have equal variance using the Bartlett’s test in statistical R software version 3.1.0 (29). Using GraphPad Prism (GraphPad software Inc, version 5.0), one-way analysis of variance (ANOVA) was performed in each region for comparing control and ‘depressed’ groups followed by a Bonferroni multiple comparison test between all groups. Differences were considered significant if the probability of error was <5%.
Results
Photostimulated luminescence signals attributed to [3H]RX 821002 binding were observed in different areas of the rat brain, and representative images at both coronal sections are shown in Fig. 2. The quantitative results, calculated from the measured light densities and the linear calibration curve created from the tritium microscale, are expressed as mean±SEM and are presented in Table 1.
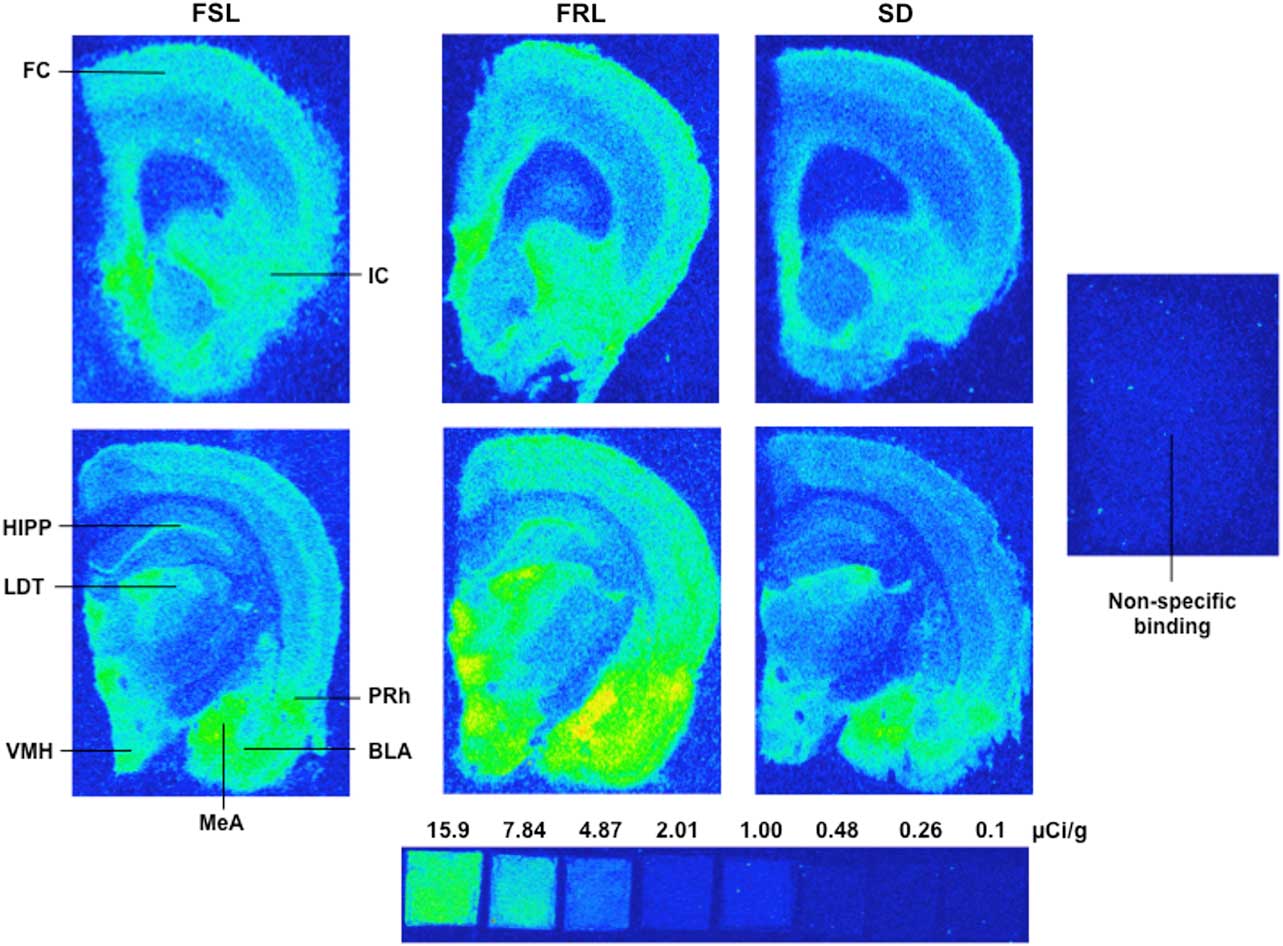
Fig. 2 A set of representative autoradiograms illustrating the regional distribution of α2-adrenoceptor binding or non-specific binding obtained at different coronal sections corresponding to the anterior–posterior: 12.24–11.76 (upper) and 6.00–5.76 mm (lower) (Reference Paxinos and Watson27) from FSL, FRL, and SD groups. FSL, Flinders-sensitive line; FRL, Flinders-resistant line; SD, Sprague-Dawley; FC, frontal cortex; IC, insular cortex; HIPP, hippocampus; LDT, laterodorsal thalamic nucleus; VMH, ventromedial hypothalamic nucleus; MeA, medial amygdaloid nucleus; BLA, basolateral amygdaloid nucleus; PRh, perirhinal cortex.
Table 1 Regional values of [3H]RX 821002 densities

BLA, basolateral amygdaloid nucleus; FC, frontal cortex; FRL, Flinders-resistant line; FSL, Flinders-sensitive line; HIPP, hippocampus; IC, insular cortex; LDT, laterodorsal thalamic nucleus; MeA, medial amygdaloid nucleus; N, number of measurements; PRh, perirhinal cortex; ROIs, regions of interest; SD, Sprague-Dawley; VMH, ventromedial hypothalamic nucleus.
Data are represented as mean [μCi/g]±standard error of the mean.
a p<0.05 between FSL and FRL; b p<0.05 between FSL and SD; c p<0.05 between FRL and SD.
Our a priori hypothesis was that the two control groups (FRL and SD) had equal receptor densities, and therefore could be merged into one group. However, both visual observation of the raw data (Fig. 2) and post-hoc analysis with Bonferroni correction revealed significant differences in four out of eight brain regions between the FRL and SD rats. Careful inspection of the raw autoradiograms (Fig. 2) also suggested that the low number of measurements in both the FRL and the SD groups may have obscured significant differences in the remaining regions including MeA, BLA, and IC. As this suggested unexpected differences between the two ‘control’ groups, we decided to run the analysis treating the FRL as a second experimental group.
One-way ANOVA was performed to determine the significant differences between the three rat groups for each region (Factor: strain). In the LDT, significant differences were found between the FSL and FRL rats (95% CI: −9.12 to −0.97, p<0.05) and between the FRL and SD rats (95% CI: 1.49 to 11.23, p<0.01). Similarly, in the MeA, significant differences were found between the FSL and FRL rats (95% CI: −6.86 to −3.18, p<0.0001) and between the FRL and SD rats (95% CI: 3.15 to 7.40, p<0.0001). In the PRh, a significant difference was found between all rat groups, FSL versus FRL (95% CI: −4.43 to −2.01, p<0.0001), FSL versus SD (95% CI: 2.37 to 5.07, p<0.0001), and FRL versus SD (95% CI: 5.59 to 8.29, p<0.0001), whereas in the FC a significant difference was found between the FSL and SD rats (95% CI: 0.77 to 3.59, p<0.01) and the FRL and SD rats (95% CI: 0.17 to 3.16, p<0.05). In the IC, a significant difference was also found between the FSL and SD rats (95% CI: 0.15 to 3.99, p<0.05).
When the FRL group was compared with the FSL group, it was found that the FRL group had a higher density of α2-adrenoceptors in most of the brain regions of interest (10% across regions), and significant differences were found in three out of eight regions. Comparing the FSL animals with the SD group, a greater mean α2-adrenoceptor binding was found in most of the regions (10% across regions), and this reached statistical significance in three out of eight regions. An increased binding of α2-adrenoceptors was found in all the regions of the FRL brains compared with the SD group (24% across regions), and significant differences were found in four out of eight regions.
Discussion
The main finding in this study is the demonstration of neurobiological differences between the female FSL, FRL, and SD rats with respect to α2-adrenoceptors. The FSL rats have been found to be a valid model of some symptoms present in depression (Reference Overstreet, Friedman, Mathe and Yadid10). We found significantly increased α2-adrenoceptor binding in the cortical regions of the FSL rats compared with control SD rats. This is consistent with our initial hypothesis based on studies in suicide victims with untreated major depression (Reference De Paermentier, Mauger, Lowther, Crompton, Katona and Horton16,Reference Gonzalez, Pascual and Meana17,Reference Meana, Barturen and Garcia-Sevilla30) and also with the suggested therapeutic action of antidepressants being partly ascribed to the downregulation of cortical α2-adrenoceptors in rat brain (Reference Subhash, Nagaraja, Sharada and Vinod19). The lack of significant differences in some of the limbic regions, despite a small trend (Table 1), may be the result of the modest sample size of this study.
Hippocampus, amygdala, thalamus, hypothalamus, PRh, IC, and FC have all been implicated to varying degrees in the aetiology of depression. Neuroimaging studies of patients with major depression have identified neurophysiological abnormalities in all these brain areas (Reference Drevets4,Reference Willner, Scheel-Kruger and Belzung31). We, therefore, examined α2-adrenoceptor binding in these cortical and sub-limbic regions, which play a crucial role in depression as seen from a therapeutic standpoint (Reference Willner, Scheel-Kruger and Belzung31).
Table 1 shows the regional distribution of receptor densities and demonstrates high variability across regions but consistency across animals. In all three strains, the highest densities of α2-adrenoceptors among the regions investigated were found in the two amygdaloid areas and in the PRh. The PRh, a subdivision of the medial part of the temporal lobe, plays an essential role in visual perception as well as in memory formation (Reference Murray, Bussey and Saksida32), and in humans decreased expression of glutamatergic receptors has been previously found in the PRh of patients with major depressive disorder (Reference Beneyto, Kristiansen, Oni-Orisan, McCullumsmith and Meador-Woodruff33). The PRh has strong reciprocal connections to higher cortical sensory areas and other memory-related structures, including the amygdala and the hippocampal formation, which are mostly involved in the regulation of emotions, anxiety, and memory processes (Reference Scoville and Milner34). Hippocampus and amygdala are the major central structures that control the hypothalamus–pituitary–adrenal axis, and damage or abnormal activity in either of these areas, such as altered noradrenergic receptor function, could start a vicious cycle predisposing an individual to an episode of depression (Reference Belzung and Billette de Villemeur35,Reference Jacobson and Sapolsky36).
The LDT, which was investigated in this study, provides massive projections to the FC in the rat brain and plays a role in learning and memory (Reference van Groen, Kadish and Wyss37). The information flux in the thalamo-cortical pathway has shown to be reduced in a stressed model of depression, suggesting a decreased control of cortical activity by the thalamus, which can be reflected by cognitive deficits (Reference Quan, Zheng and Zhang38). Moreover, patients with major depressive disorder have an elevated number of neurons in the limbic thalamus relative to non-depressed controls (Reference Young, Holcomb, Yazdani, Hicks and German39). Collectively, the impairments in the firing pattern between the LDT and the FC and the increased number of α2-bearing neurons in the thalamus may contribute to the increased adrenoceptor density found in our laterodorsal thalamic region in the FSL and FRL rats.
Alternatively, and this possibility exists in all our examined regions, a sustained functional decrease in noradrenaline release, most likely due to increased number or over-activity of α2 inhibitory autoreceptors localised on the neuronal cell bodies of locus coeruleus, would lead to compensatory upregulation of the postsynaptic α2-receptors in the projections areas. To address this hypothesis, it would have been necessary to perform autoradiography at the level of the brainstem and pontine nuclei housing the noradrenergic cell bodies. Unfortunately, the original study required the two halves of the brain to be processed separately for different analyses, and the brainstem areas were insufficiently preserved, especially medially, to allow for adequate sectioning and labelling.
Other neurochemical differences between the FSL rat model of depression and its two controls have been described in the literature. Overstreet et al. (Reference Overstreet, Russell, Crocker and Schiller40) found FSL rats to have higher concentrations of both the muscarinic acetylcholine receptor and endogenous acetylcholine than their controls, FRL rats, in specific brain regions, explaining their increased sensitivity to anticholinergic drugs. Differences in the serotonergic systems have also been found; Hasegawa et al. (Reference Hasegawa, Nishi, Watanabe, Overstreet and Diksic41) described a reduction in serotonin synthesis in the FSL rats compared with both FRL and SD rats, an effect ameliorated by chronic citalopram treatment (Reference Kanemaru, Nishi, Hasegawa and Diksic42). Moreover, the glutamate receptors have been found to be reduced in the FSL rats compared with both the controls (Reference Kovacevic, Skelin, Minuzzi, Rosa-Neto and Diksic43). Overall, the neurochemical phenotype of the FSL rats is distinct from its two controls, displaying a pattern mimicking what has been found in brains of depressed patients.
Our use of two control groups proved to be a strength in detecting important findings. The higher binding found in FRL rats compared with SD rats was surprising, and only little is known about the differences between FRL and SD rats. Although the FRL strain is an inbred line, originally derived from the outbred SD rats, they are, in the literature, used interchangeably with SD rats as controls for FSL rats. The present results suggest that such substitution should be done with care. Moreover, the concept of SD rats as a uniform entity is questionable, due to the many different lines bred by commercial suppliers today, where variable husbandry practices may lead to variable early-life experiences of which we are not aware.
The fact that female rats were investigated in this study is important for balancing studies in male and female models, and it is also a strength because higher depression rates are observed in women than in men. However, differences between male and female Flinders rats have not been thoroughly investigated to account for validity of the FSL/FRL females as a proper model system for affective disorders.
The condition under which the study was conducted may have exacerbated the differences between the two control strains: studies suggest that the FRL animals express the most differences from the FSL during stressful situations (Reference Pucilowski, Overstreet, Rezvani and Janowsky9,Reference Wegener, Harvey and Bonefeld44). The animals whose brains were used in this autoradiography study were the control (sham) animals of a larger study regarding the effects of electroconvulsive shocks (Reference Lillethorup, Iversen, Fontain, Wegener, Doudet and Landau26). As such, all groups were handled for 10 days, a situation that could produce mild stress in more sensitive rat strains such as the FRL and FSL rats, and may have possibly played a role in the upregulation of α2-adrenoceptors in this study.
The present study should be replicated in a larger group of animals of both sexes, bred and raised together and tested at multiple time points before final conclusions for or against the validity of FRL animals as controls can be reached.
In conclusion, our findings of higher α2-adrenoceptor density, especially in cortical regions, in the FSL animals compared with control SD rats is consistent with human post-mortem studies and further validate the implication of the noradrenergic system in the pathophysiology of depression and support the FSL rat as a model of depressive/anxiety type disorders with construct validity. Furthermore, our preliminary findings in a small sample of female animals suggest that it is advisable to always include SD rats as an extra control for the FSL rat model when conducting neurochemical studies.
Acknowledgements
The authors thank Professor Jørgen Scheel-Krüger, MSc, DMed and Professor Andrew Tasker, PhD, for insightful comments on this manuscript. Authors’ contribution: G.W., D.J.D., and A.M.L. designed the study. G.W. bred the FSL and FRL rats at the Centre for Psychiatric Research, Aarhus University Hospital, and P.I. conducted the tissue preparation. T.P.L. performed the autoradiography experiments and analysis, under the supervision of A.M.L. and prepared the first draft of the manuscript and figures. All authors commented on the manuscript and have approved the final version.
Financial Support
This study was supported by the Danish Medical Research Council and by the Th. Maigaards Eftf. Fru Lily Benthine Lunds Fond.
Conflicts of Interest
G.W. is Editor-in-Chief in Acta Neuropsychiatrica. However, G.W. actively withdrew from any decisions related to the review of the present manuscript.
Ethical Standards
The authors assert that all procedures contributing to this work comply with the ethical standards of the relevant national and institutional guides on the care and use of laboratory animals.


